Custom KPI Groups in Process Explorer
The KPI Groups feature is used to create groups of custom process KPIs to display in the process graph in Process Explorer. You can create a KPI Group by selecting existing process-related KPIs or defining your own KPIs in the visual editor. KPI Groups can be created for both case-centric (single event log, multi-event log) and object-centric process exploration components.
Custom KPI groups allow you to bundle related KPIs for activities/events within a single eventlog or track a specific KPI across multiple event logs. For example, a KPI Group could be comprised of the automation rate of each activity and the duration between them, for one event log. If your Process Explorer is configured with multiple event logs, in the same KPI group you can also create KPIs for each eventlog in your Process Explorer to track the same KPI across multiple event logs.
Both KPI Groups and the individual KPIs in those groups are created and stored within a Knowledge Model. As a result, if a change is made to an individual KPI, it is automatically updated across all KPI Groups to which that KPI has been added.
Note
Custom KPI Groups are only available in Studio Views. For components created in Legacy Views, KPIs are still defined using YAML in the Knowledge Model.
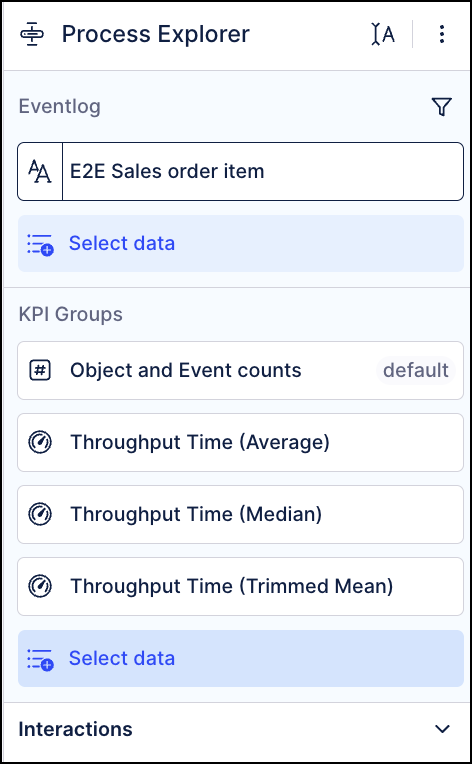 |
The available KPI groups are displayed on the Settings tab by clicking the edit icon and selecting the process visualization component. The available custom KPIs groups are displayed in the KPI Groups section. From this section, you can create new custom groups, show or hide existing groups, remove a custom group, or change the order in which the groups are displayed in the KPI selector dropdown.
Note
The default KPIs are still available in the Interactions section of the Settings tab.
The order in which the custom KPI groups are displayed in the KPI Group ls section is the order in which they will display in the KPI selector dropdown. To change the order, click and drag the groups into the proper order.
|
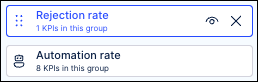
Custom KPI groups are only available to use in the process graph if they are visible. To make a KPI group visible, click the eye icon on the group tile to make sure it’s accessible. To hide a KPI group, click the icon again to hide a group from the dropdown. Hidden KPI groups will be grayed out. To remove a KPI group, click the X on the right side of the tile.
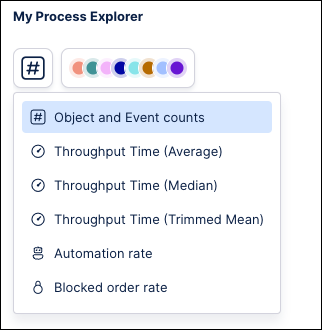
Once the KPI groups have been added, they will display in the KPI selector dropdown on the process graph. To apply a KPI group, select it from the dropdown.
 |
The custom KPIs will be displayed in your process graph. It is important to note that how your KPIs are displayed will vary based on if the KPIs were created on the Activity or the Connection (see the Create a custom KPI Group section below for more details).
Activity KPI: The Activity node always displays the Case Count (in case-centric) or Event Count (in object-centric) as the first KPI, followed by the custom Activity KPI. If the KPI group is comprised of more than one Activity KPI for an event log, then a maximum of two custom Activity KPIs are displayed on the Activity nodes on the graph. You can click on an Activity node to display all the Activity KPIs for that connection in the details pop-up window.
Connection KPI: If the selected KPI group is comprised of more than one Connection KPIs for an event log, then the first Connection KPI for that event log is displayed on the connections in the process graph. If you click on that connection, you can view all the Connection KPIs for that connection in the details pop-up window.
Once your custom KPI Groups have been created, they can be shared with other users for use in their Process Explorer components.
In your Process Explorer, click the Edit button in the upper right.
Select your process graph component and then click the Settings tab in the edit panel on the right.
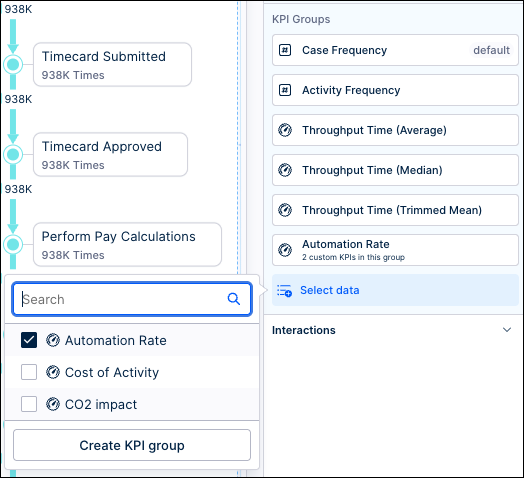
In the KPI Groups section, click the Select data button.
Click the Create KPI group button.
Note
Custom KPI groups that have been created but not added to the process graph will also be displayed. To add one of these groups, select the checkbox and the group is added or removed.
In the KPI Group settings window, choose an icon from the dropdown and then enter a Group name.
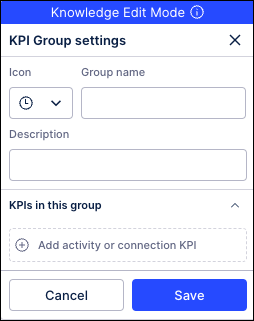
Enter a Description for this KPI Group.
Note
This description will be the value displayed in the KPI selector dropdown on your process graph for the KPI Group you are creating.
Click on the Add activity or connection KPI field.
In the KPI Settings window, choose if the KPIs in this group are applied on the Activity or the Connection.
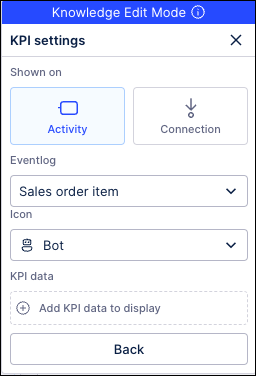
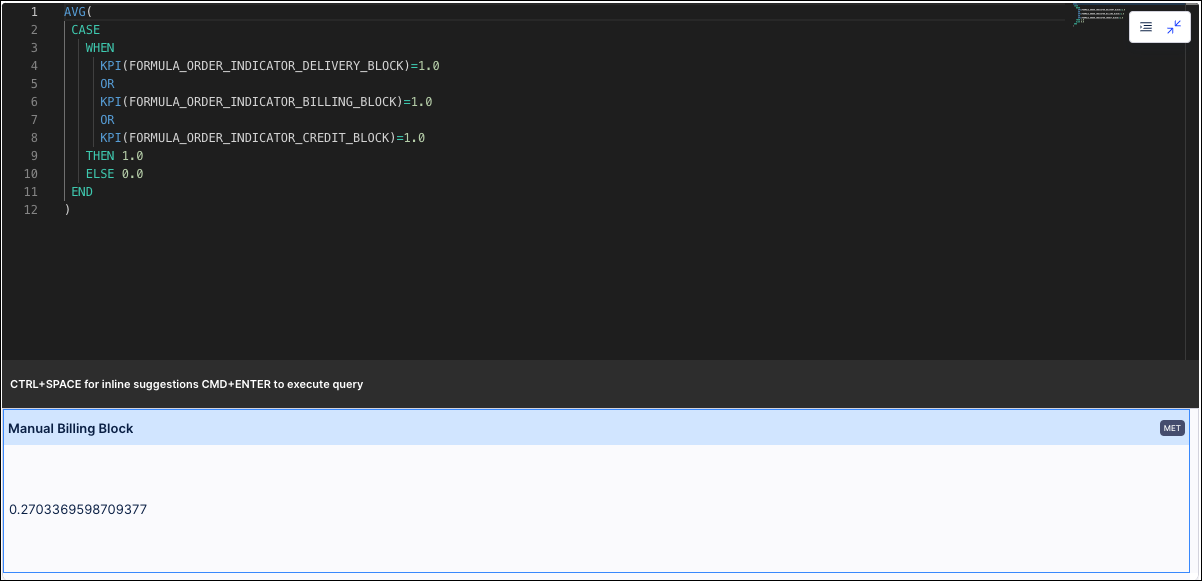
Activity KPI: An Activity KPI is calculated and displayed on the activity/event node in the process graph.
Example of an Activity KPI for Automation:
AVG(CASE WHEN "EVENTLOG"."USERTYPE" = 'Batch' THEN 1.0 ELSE 0.0 END)
Connection KPI: A Connection KPI is calculated and displayed on the connections between nodes in the process graph.
Example of a Connection KPI for Duration:
AVG(1.0*DATEDIFF(dd, SOURCE("EVENTLOG"."EVENTTIME"), TARGET("EVENTLOG"."EVENTTIME")))
Choose the Eventlog where this group will be applied from the dropdown.
Note
To add a KPI based on an eventlog that was created by modifying an existing activity table or event log, you will need to reference the original activity table in the PQL statement for the KPI definition.
Click the Add KPI data to display button to open the Knowledge Editor and create your KPIs.
Note
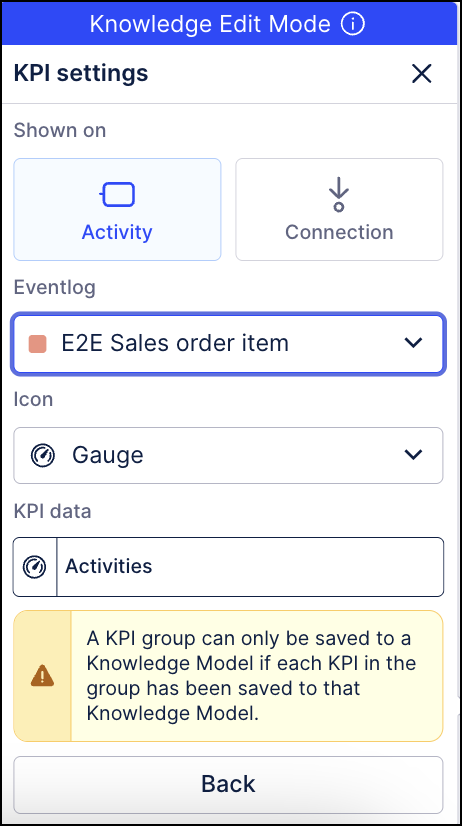
The KPI must be saved to the Knowledge Model before being used in a KPI group.
Repeat these steps to create additional KPIs.
Note
To display the same information from different event logs, you will need to create separate KPIs for each event log.
Click Back when finished adding KPIs.
On the KPI Group settings window, click Save.
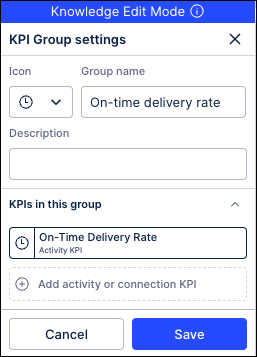
Click Save in the confirmation window. The new group is now displayed in the KPI Groups section.
The PQL Editor is used to create KPIs through PQL statements directly in the editor window or by selecting from the list of Data, Metrics, Filters, Values, Formulas and Variables in the panel on the left. You can preview the results of your statement as you build using the preview window below the editor.
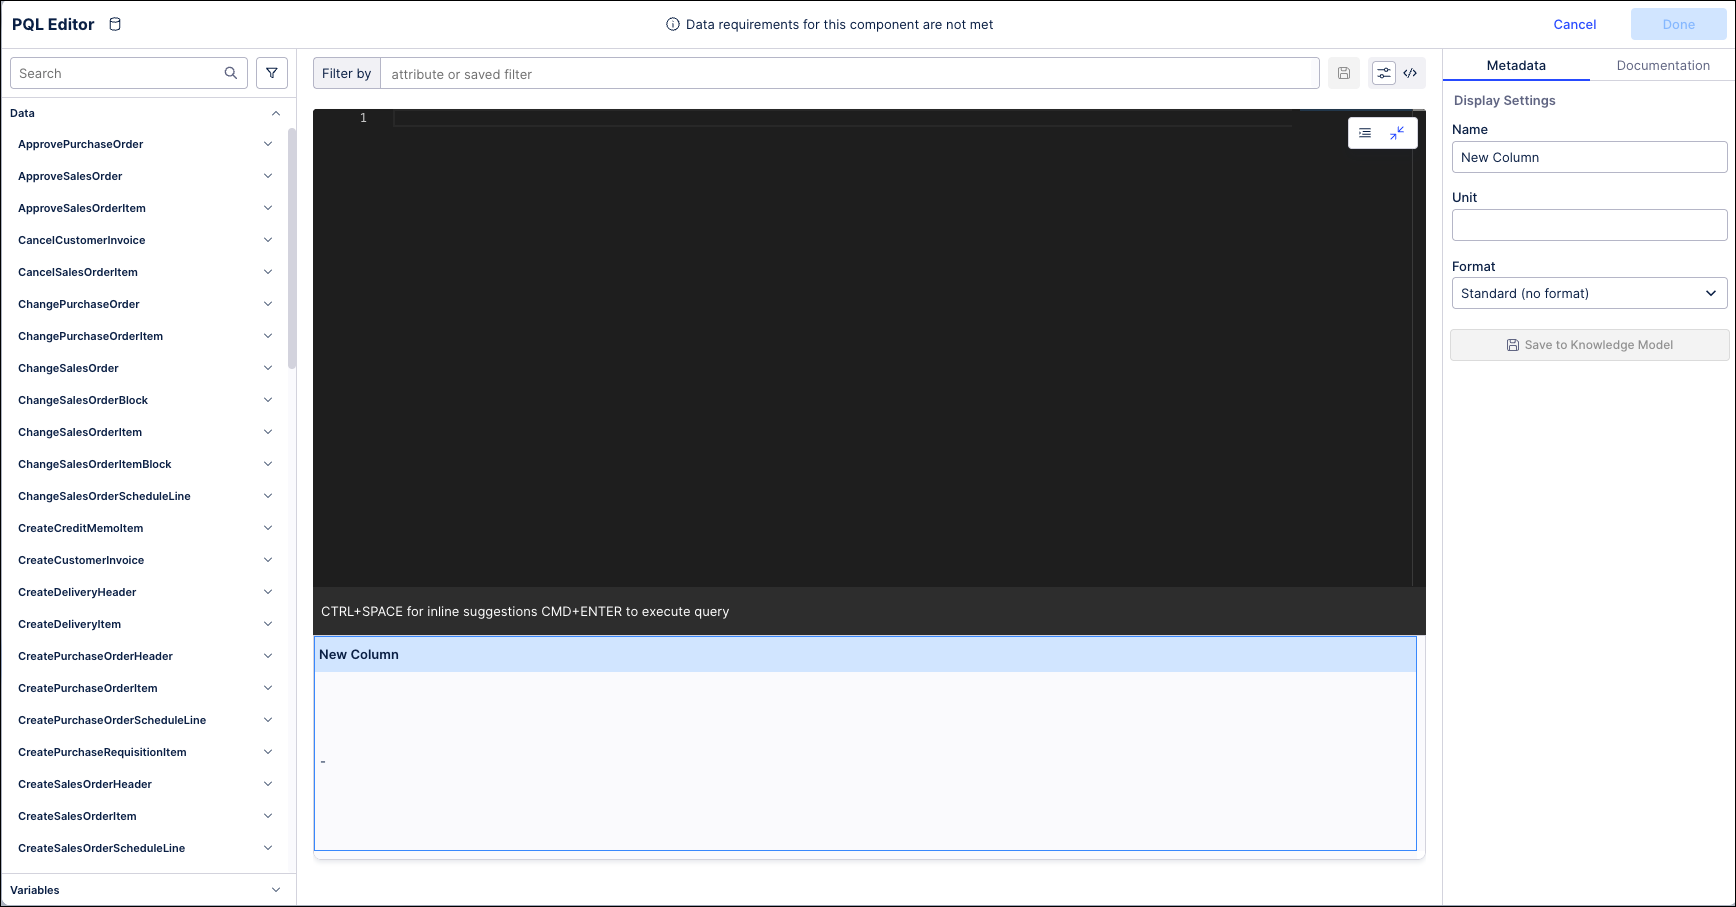 |
In the PQL Editor, enter a Name and Description for this KPI in the Display Settings section on the right.
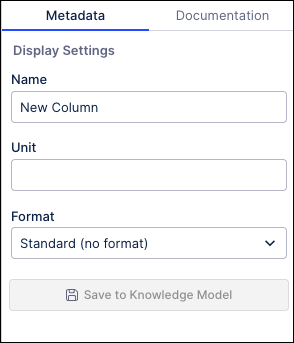
Use the Format dropdown to select the specific format in which the KPI value will be displayed, such as a percentage, decimal number, date, etc.
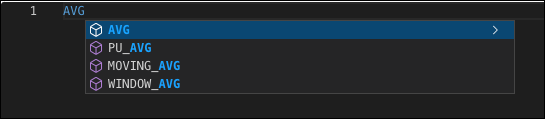
In the black PQL Editor window, you can manually enter the code of your statement. As you type, the editor will make intelligent suggestions based on your entry that you can select.
You can also create your statement by selecting any of the data, metrics, values, or filters from the panel on the left. Clicking any of the items from the panel will insert the corresponding code into your PQL statement.
Note
To add a KPI based on an eventlog that was created by modifying an existing activity table or event log, you will need to reference the original activity table in the PQL statement for the KPI definition.
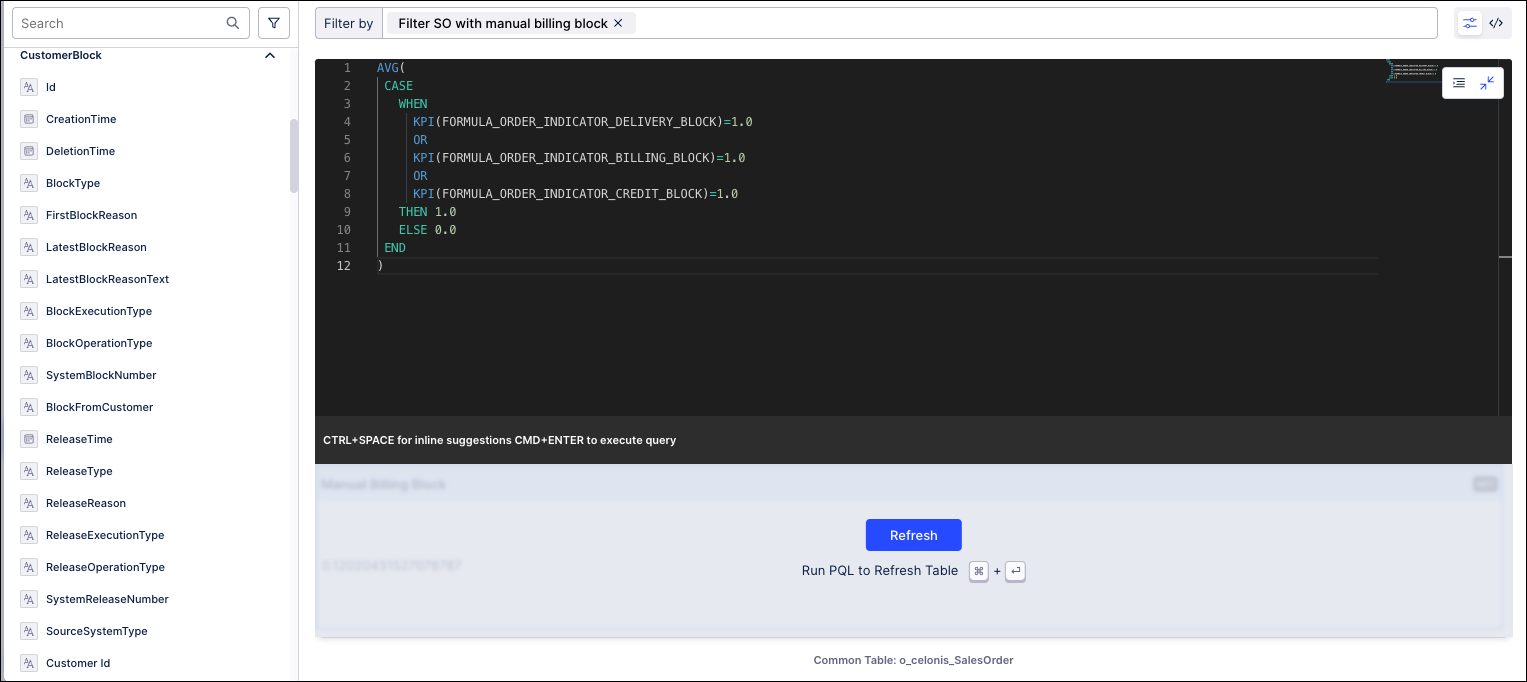
As you build your KPI, the window at the bottom of the screen will display a preview of the data returned by the current PQL statement. As you add more values, click the Refresh button to update the preview with the latest version of the statement.
Note
Only a single value will display in the preview when including a metric selected from the panel on the left.
Once your statement is finished, click the Save to Knowledge Model button on the right.
Note
The KPI must be saved to the Knowledge Model before it can be added to a KPI group. Once the KPI is saved to the Knowledge Model, it is also available to be assigned to other KPI groups or Views.
Once your KPI is complete, click the Done button in the upper right corner of the PQL Editor. The KPI is saved and added to your custom KPI group.
Repeat these steps to add additional KPIs to the custom group.
While custom KPI groups can be created from within your Studio View, to delete a KPI group, the Analyst will need to remove it from the Knowledge Model.
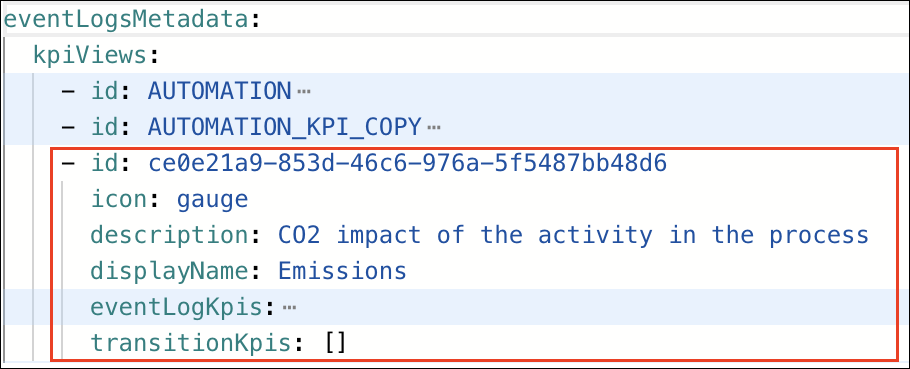 |
In the example above, a KPI group named "Emissions" had been created along with other KPI groups. To delete the "Emissions" KPI group, you have to:
Go to the Knowledge Model and switch to the YAML editor.
In the eventLogsMetadata section, locate the entry containing
displayName: Emissions.Delete the entry, including all the nested properties such as
eventLogKpisandtransitionsKpis.