Event Explorer component
The Event Explorer component displays a list of the events within the event logs selected from your Knowledge Model (KM), giving your app users the ability to click on available events and view further details. Event Logs contain sequences of events which are defined in your data model and can be stored as dedicated entities within the Knowledge Model. This enables you to use the contents of your event logs inside your Studio Views, including with the Event Explorer.
For more information about event logs, see: Event logs (case-centric) or Event logs (object-centric).
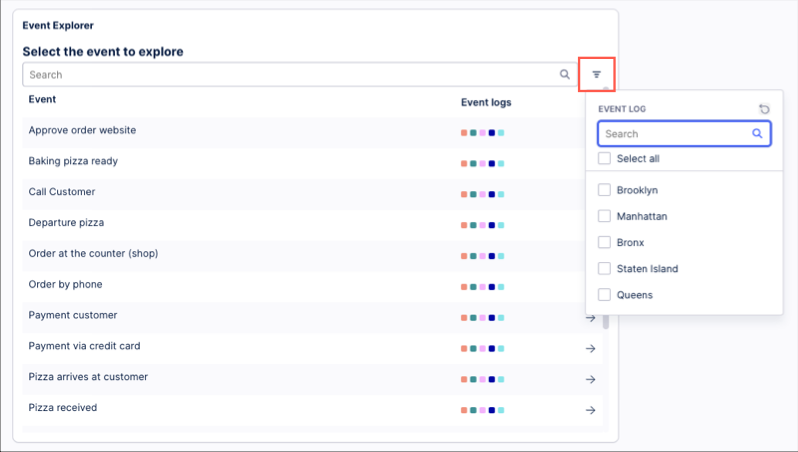
In this event explorer example - the app user can see the events involved in running a pizza business. By clicking the "Call customer" event, they can then see the related event logs and use these to filter their content.
 |
To configure an event explorer component for your Studio View:
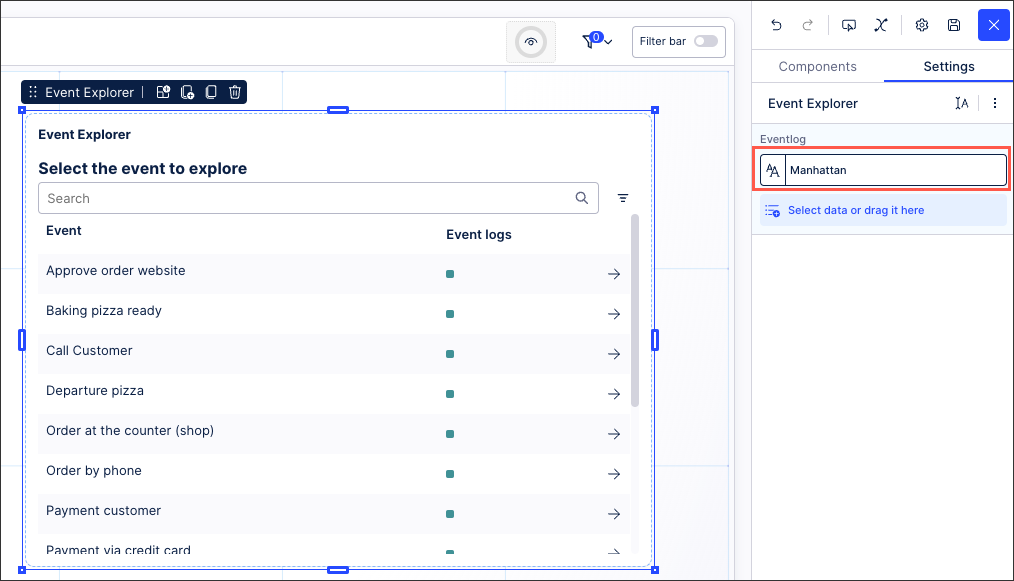
In View Edit Mode, drag and drop the event explorer component into your View. The default event log from the KM is automatically selected.
In this pizza example, the Manhattan branch of the pizza company's event is selected:
Open the component settings menu and customize your configuration using the following options:
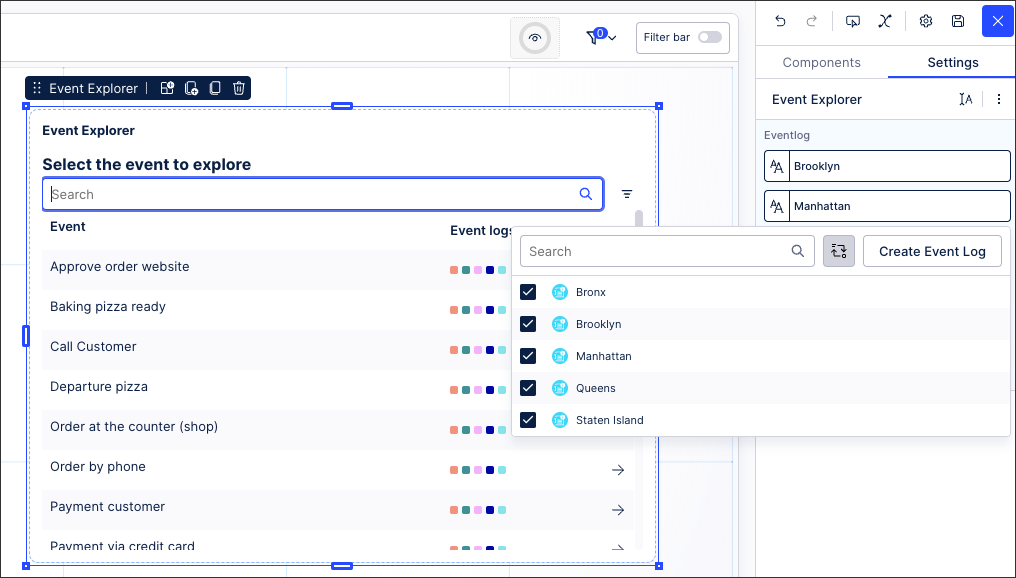
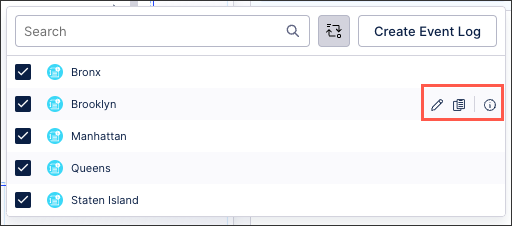
Search for and select additional event logs: You can change this event log or include additional event logs from your Knowledge Model by either selecting the event logs or dragging them into the side panel. In the pizza example, we'll add the Brooklyn, Bronx, Queens, and Staten Island branches from the pizza company.
Reorder event logs: The first event log in the list is the default, used whenever the component loads. The other event logs can be selected by the user when viewing the app by changing the filter. You can reorder the selected event logs to change the default.
Create Event Log: Use the side panel to create an event log and save it to your Knowledge Model without navigating away from your View. This event log can then be used in the event explorer component.
You then have the following options for individual event logs within the side panel, saving you from navigating away from your view:
Edit event log: This allows you to edit the individual event log in your Knowledge Model.
Duplicate event log: This creates a duplicate of your event log within the Knowledge Model. The duplicate event log can then be edited in the side panel, also saving you from navigating away from your view.
View event log details: This includes the PQL reference for the event log.
Click Interactive Mode and preview your event explorer configuration.
Optional: To see the latest version of your View, deploy the package.
Either in a published app or while in interactive mode (available while editing your View), the Event Explorer component is interactive. You can interact with it in the following ways:
Search: Use the search to find specific events within the Event Explorer.
Filter event logs: Choose which event logs to use as a filter.
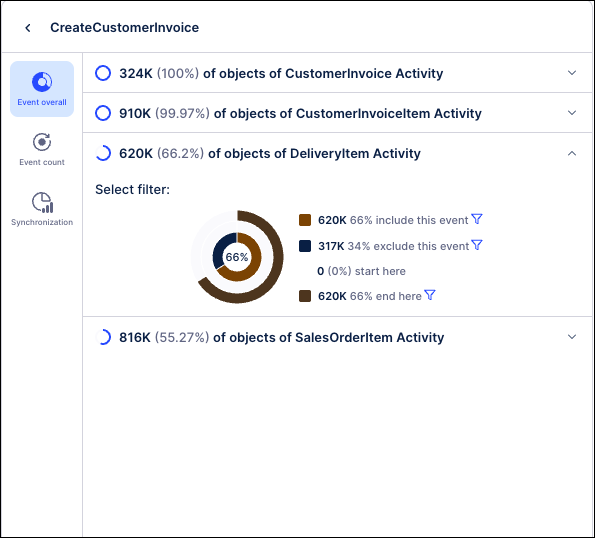
Clicking the arrow to the right of the event logs shows you an overview of event metrics, such as how many objects in a process are involved in that event, how often an event occurs, or how the timing of the objects occurs across shared events.
Event overall tab
The Event overall tab shows usage details for this event, such as how often this event occurred in other processes, what percentage of processes do not include this event, and how often this was the first or last event in a process.
The following metrics are available on the Event overall tab and can be used as filter criteria:
Objects that include the event
Objects where the event is excluded / doesn't feature in the process
Objects that start with this event
Objects that end with this event
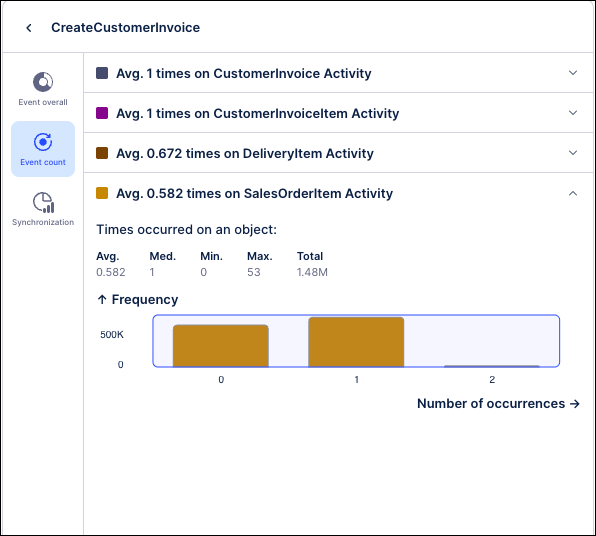
Event count tab
The Event count tab allows you to view the average number of times the selected event occurs in each of the event logs / processes. You can also filter to view only objects where an event occurs less or more times than a defined threshold.
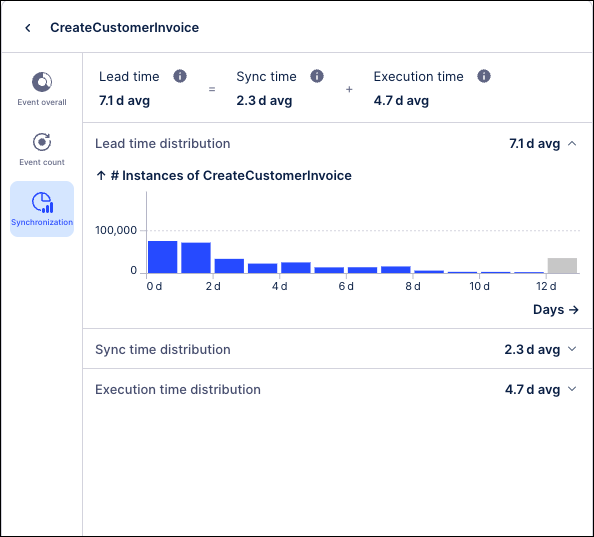
Synchronization tab
The Synchronization tab details the object-centric performance metrics that are calculated across all shared events in the process. The Synchronization tab shows the range of times for each metric and how frequently each time value occurred across the events in this process:
Event Lead Time: The total duration from when the earliest input object becomes available to the completion of that specific event. Event Lead Time can be thought of as the total amount of time needed for the preparation and execution of all steps in the process.
Synchronization (Sync) Time: The time between when the first and last input objects arrive at a shared event. Sync Time captures the delay caused by waiting for all involved objects to be ready.
Execution Time: Amount of time from when all input objects are available to when execution is complete. During this period, all objects are ready and nothing is blocked on the data side, but no action occurs.