Process Copilot Monitoring
The Monitoring screen provides insight into how your Process Copilots are being used and the quality of the responses they are generating. The Monitoring screen shows details for every conversation for this Process Copilots, including a rating of how successful the responses were and a full transcript of each conversation. From this screen you can track the date and time of each conversation, if it is located in Studio or Apps, any user feedback to its responses, how often it has been shared, and an overall quality score for each response. The Aggregate Quality Overview panel at the top of the screen also provides a high level overview (Quality Score (AVG) %) of the quality of responses generated by this Process Copilot and a summary of common failure types to help identify systemic issues.
Note
The list of past conversations will only display on the Monitoring screen if:
Your team's Admin enabled monitoring via the Admin & Settings module AND
There are no data model permissions assigned on the connected DM.
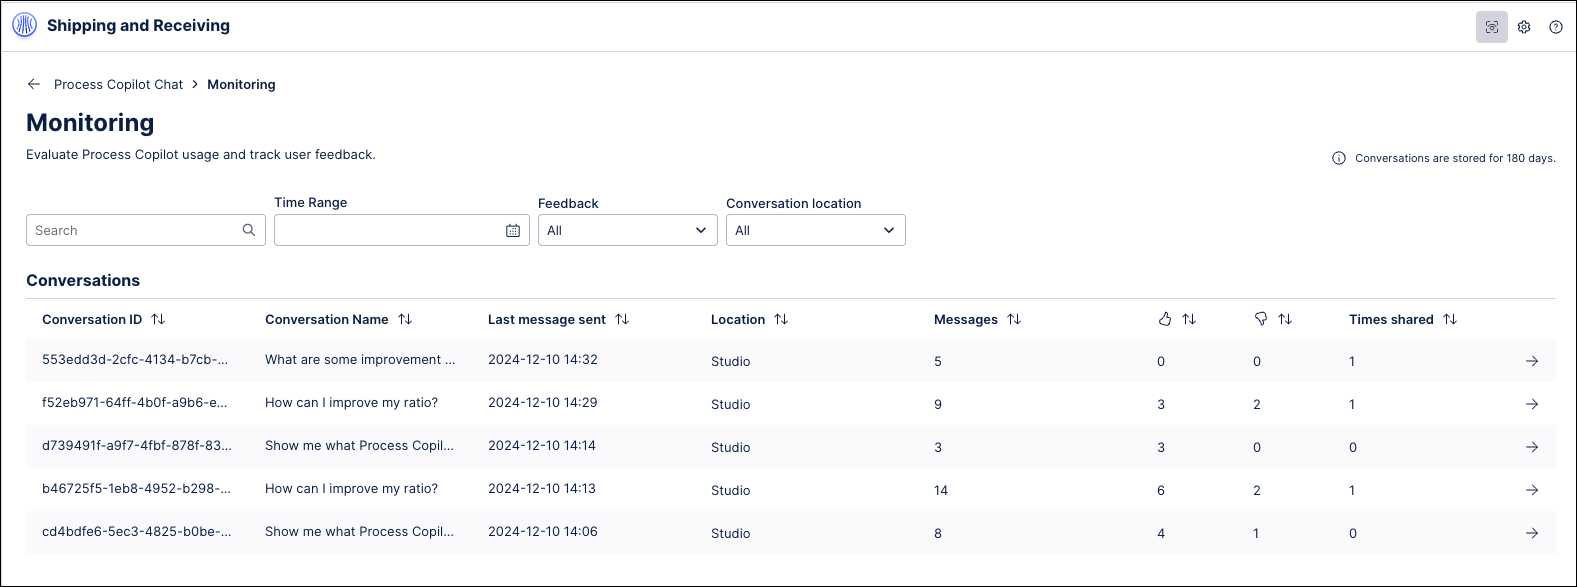 |
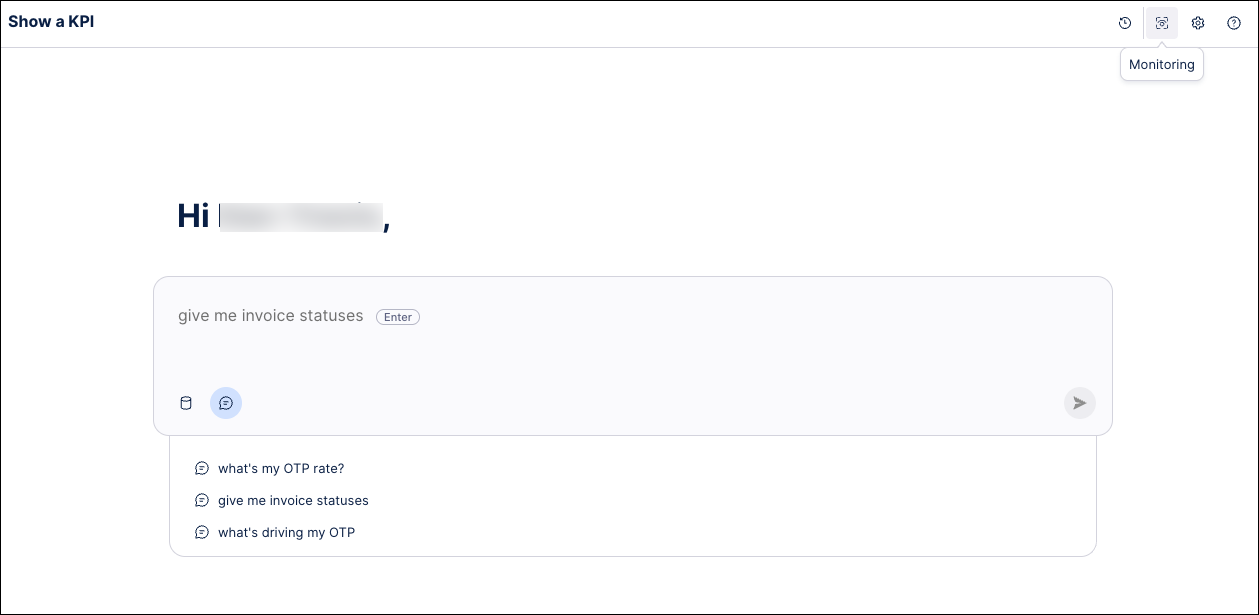
To access the Monitoring screen for a Process Copilot, click the "Monitoring" icon in the header of the main chat window. This will display the Monitoring screen for all conversations within this Process Copilot in the past 180 days.
 |
You can filter the table on the Monitoring screen to view conversations from a specified timeframe, by if the conversation was in Studio or an app, or based on the type of user feedback received.
 |
You can also click on any conversation to view a full transcript of all questions and responses in that session.
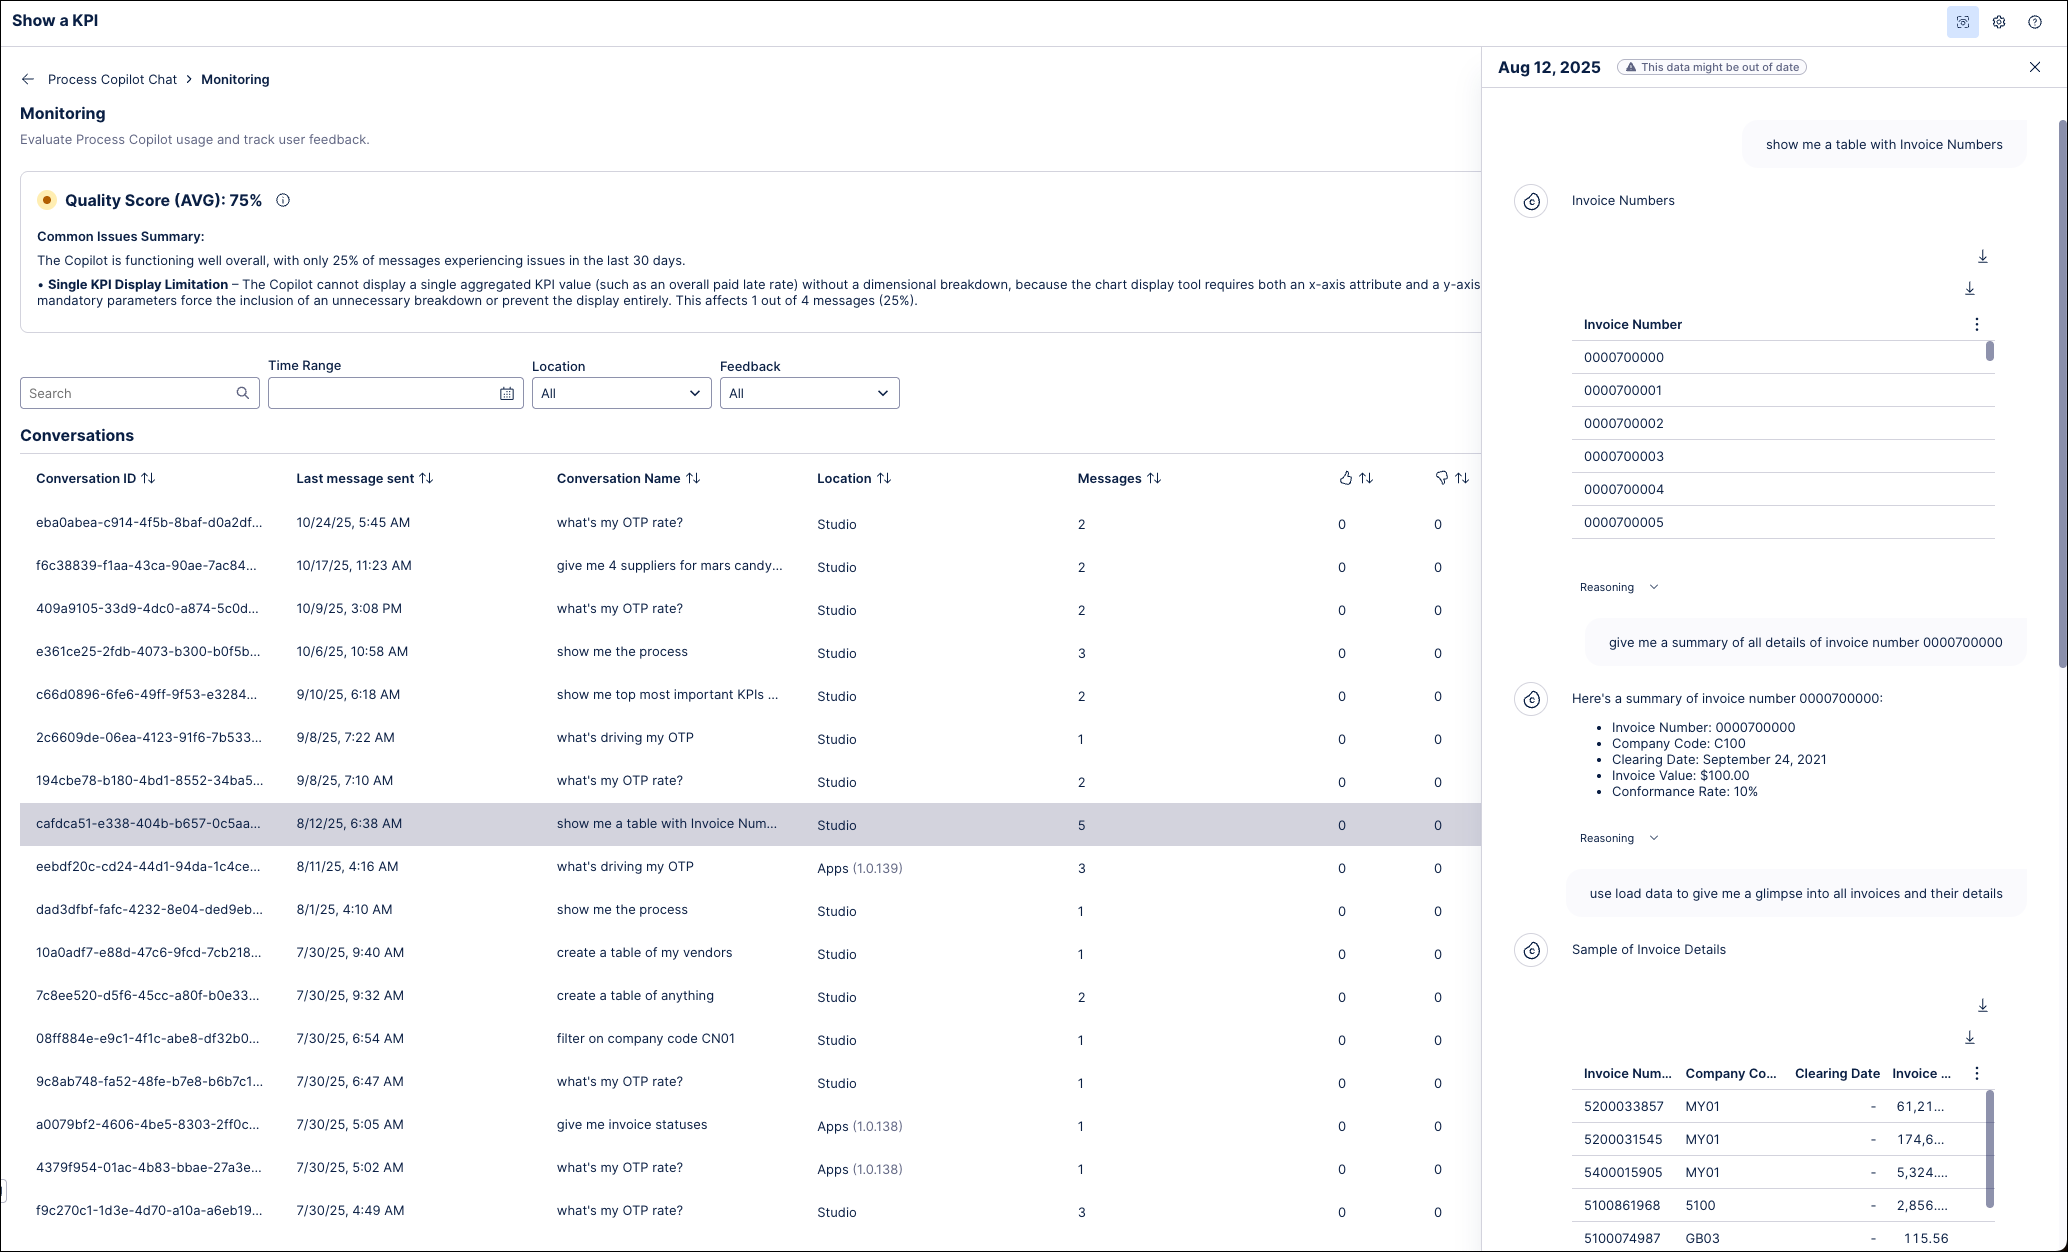 |
For low-scoring messages, the conversation transcript displays a Quality Score Driver message with an explanation for the failure of this message. These messages make it easier to identify the issue with this response and resolve the root cause of the problem.
 |