World map component
You can configure a world map component for your Studio Views, allowing you to visualize global data geographically. This component uses either coordinates (latitude and longitude) or country codes (ISO standard) to add a data layer to the world map, with customization options such as labels, metric values, colors, and legends possible for both map layers.
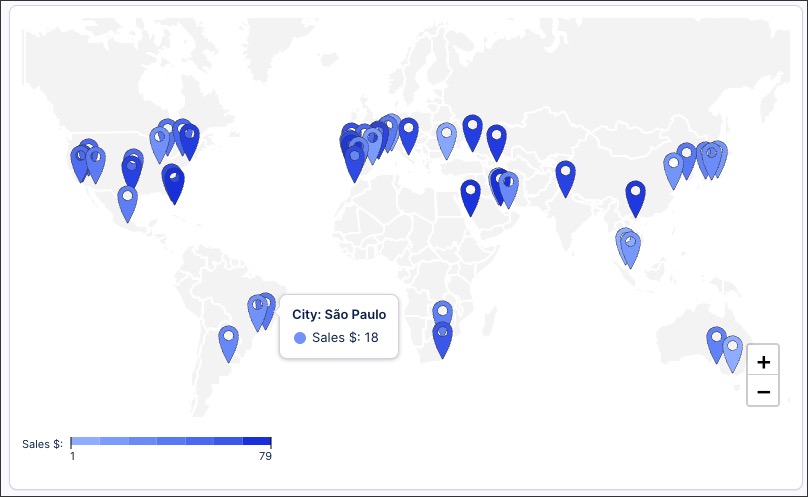
In this example, coordinates are being used and a point mark layer is added to the map:
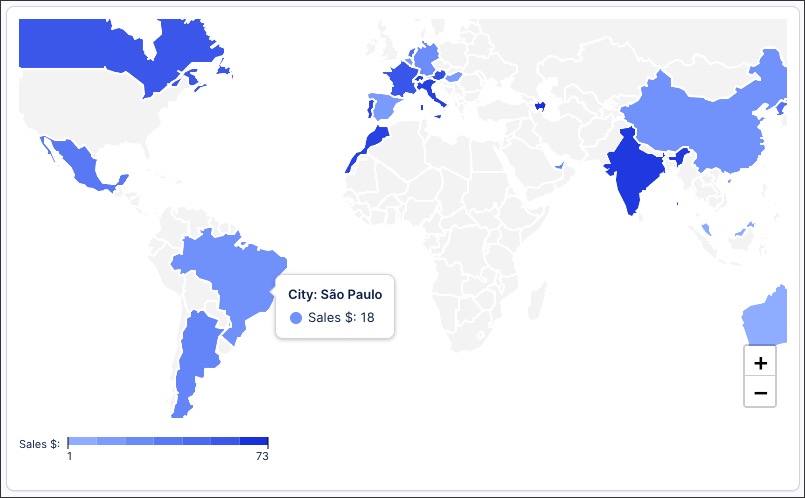
In this example, ISO country codes are used and an area layer is added to the map:
Configuring a world map component
To configuye a world map component for your Studio View:
In View Edit Mode, drag and drop the world map component into your View.
Open the component settings menu and customize your configuration using the following options:
Dimensions - Show locations by: Configure how you want the map locations to be displayed, choosing from:
Coordinates: Select Knowledge Model objects that contain the latitude and longitude of the locations. When coordinates are added to the location field, then a point mark type is used.
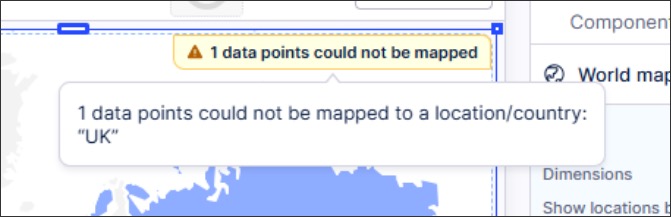
Country codes: Select Knowledge Model objects that contain an ISO standard country code. When country codes are used, the entire counties will be colored based on the KPI metric. Any country codes not recognized (e.g. UK’s country code is actually GB), a warning message is displayed:
Location label: Use this field to customize the tooltip label, for example showing the city name instead of the coordinates.
Metrics - location KPI value: Select the metric from your Knowledge Model that you want to points or areas to display, for example total sales or profit.
Alternative display options: Based on your configuration, you may be prompted to try displaying your data using other Studio component types. If you select an alternative type, any configurations made to your world map component will be reset to default.
Interactions: Enable and disable whether users can set temporary filters when interacting with that component. For more information, see: Temporary filters for Apps.
Exclude from user filtering: When enabled, this prevents the app user from apply a temporary filter to the data within the component.
Exclude from pre-defined filters: When enabled, this removes the component from any filters that are set on a View and tab level.
Can't be used to set filters: When enabled, this prevents the app user from using the component to set temporary filters for the whole View.
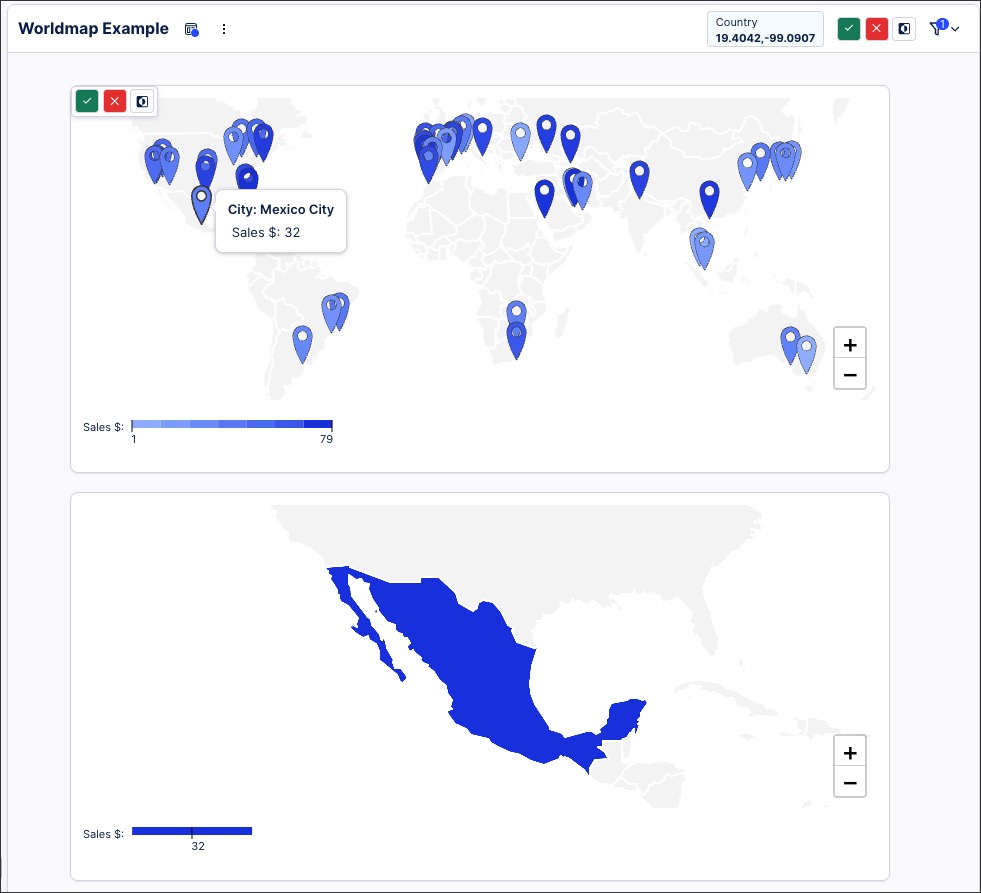
In this example, the user is filtering the View by clicking 'Mexico City' on the top world map. This then filters the whole view, updating the lower world map to show only Mexico:
Coloring: Select the colors for each of your metrics. For recommendations on effective colors, see: Studio coloring best practice.
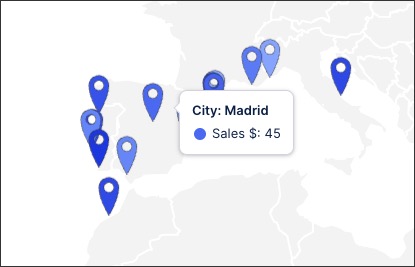
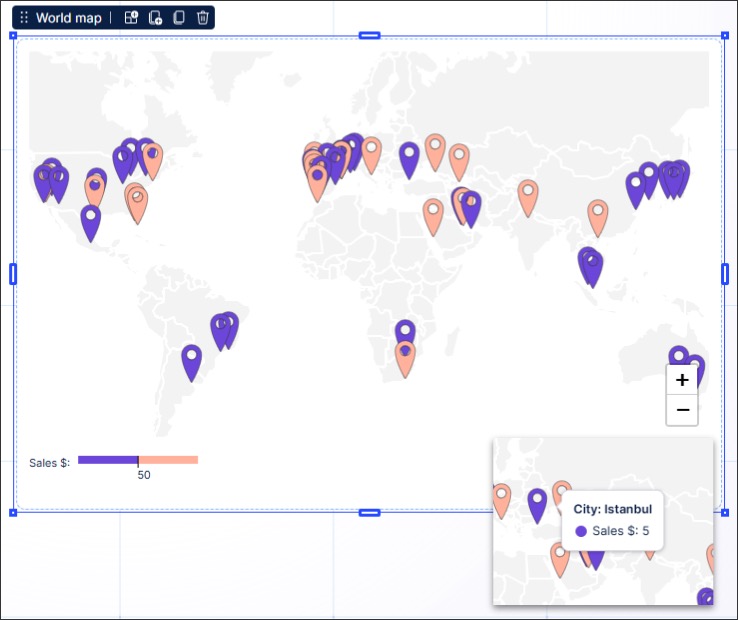
In this example, a custom color theme is being used to show locations where sales are above / below a value:
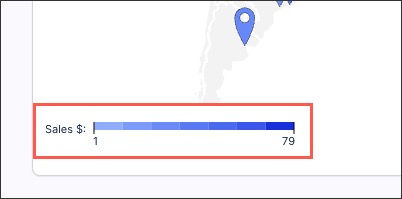
Style: Choose whether the legend is displayed on the world map or hidden from app users. For example, this chart includes a legend showing the scale of total sales (from lighter to darker contrasts of blue).
Click Interactive Mode and preview your search configuration.
Optional: To see the latest version of your View, deploy the package.