Pivot table
You can add and configure a pivot table for your Views, allowing you to summarize, analyze, and present large datasets without altering the original data.
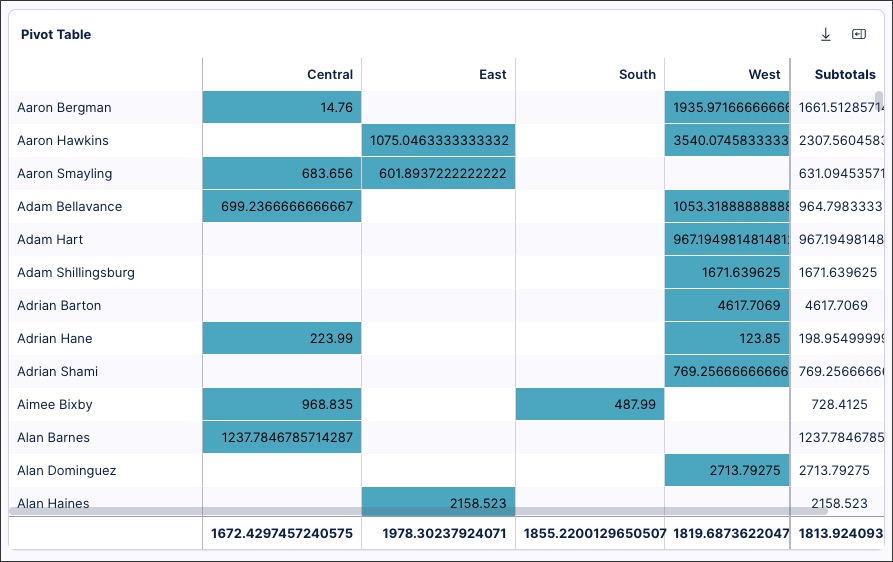
In this example, a pivot table is used to display customer sales information based on regions. Each cell represents the average sales per customer in that region, with their customer and region subtotals displayed. Any cells with a positive value are then colored, making the table easier to read.
To configure a pivot table for your Studio View:
In View Edit Mode, drag and drop the search component into your View.
Open the component settings menu and customize your configuration using the following options:
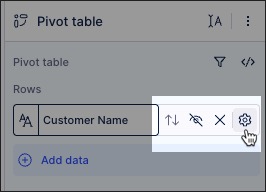
Rows: Use the PQL editor to choose the data to display per row in your table. In our example, we've selected 'Customer name' and sorted this alphabetically.
For rows, columns, cell values. and additional data fields, you can hover over the settings icon to sort, change visibility, and configure behaviors and color mappings.
Columns: Use the PQL editor to choose the data to display per column in your table. In our example, we've selected sales 'Regions' (Central, East, South, and West).
Cell values: Use the PQL editor to configure the value that your rows and columns are measured by. In our example, we're calculating the sales average per customer in each region.
You can then use the cell settings to color the cells in your pivot table. The pivot table component supports threshold and gradient coloring based on the metric value. You can apply the color to the entire cell (as a background) or highlight only the value—just like in the standard table component.
For more information about effectively coloring table components, see: Column colors.
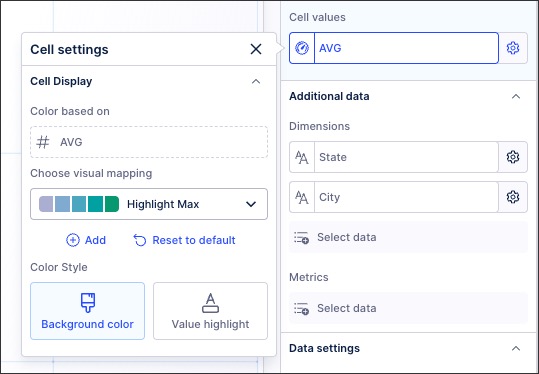
Additional data - Dimensions and Metrics: You can also use the PQL editor to add additional dimensions and metrics to your pivot table. For example, you could add countries or cities to the table, giving more localized information.
This data is not displayed to App users by default, instead they can use the configuration panel to dynamically change what rows, columns, and metrics are shown in the published table:
Data settings - Show row and column subtotals: Select to display row and / or column subtotals within your pivot table.
Interactions: These settings allow you to configure what type of interactions a user can have with your table.
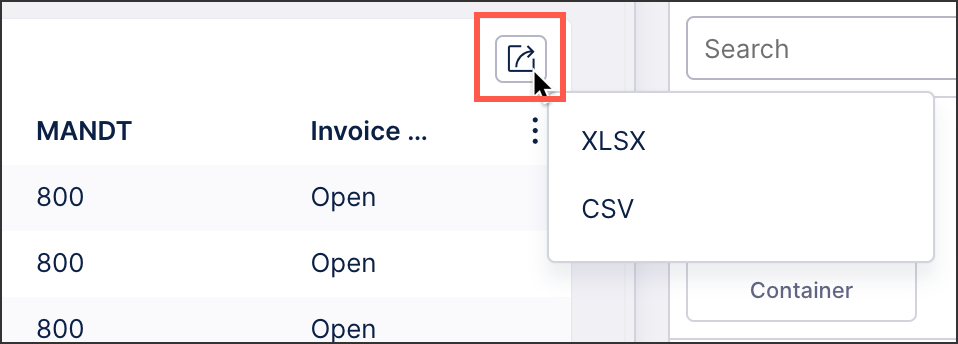
Allow exporting from table: When enabled, this allows app users to export the table as an XLSX or CSV file.
Exclude from user filtering: When enabled, this prevents the app user from filtering the data within the table.
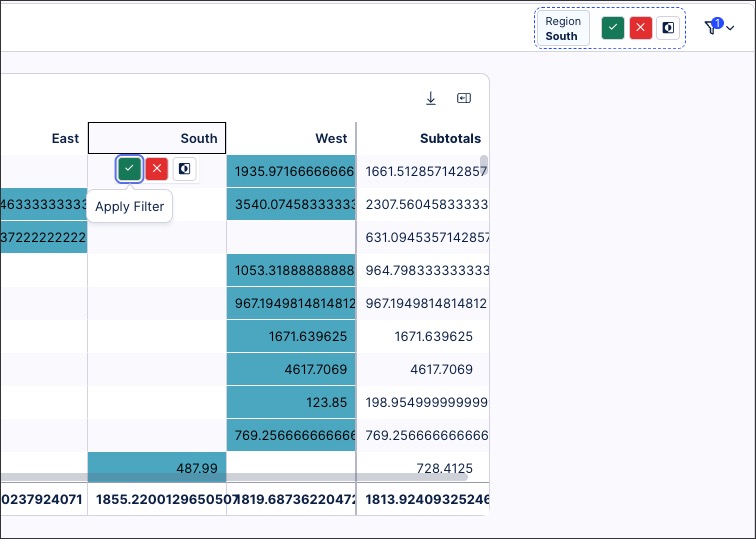
Can't be used to set filters: When enabled, this prevents the app user from using the table to set filters for the whole View.
For example, when this setting is disabled, clicking on the 'South' region allows you to filter the whole view based on that region:
For more information on user filtering using Studio components, see: Temporary filters for Apps.
Style: Choose how the data is displayed in your pivot table.
Column spacing:Choose from fit to content (where the column is sized based on the length of the data) or fit to width (based on the width of the table component in the View).
Cell density: Choose the row spacing for your pivot table.
Click Interactive Mode and preview your search configuration.
Optional: To see the latest version of your View, deploy the package.