July 2025 Release Notes
TASK MINING Version 2.20.0 of the Task Mining Desktop Client application (2025-07-31)
We've released a new version of the Task Mining Desktop Client application which includes two new endpoints that provide improved reporting of the Task Mining Client application state and event and state changes to the cloud backend.
For more information, see Release/Patch Notes Client and Configuration Editor and API endpoints for Task Mining.
STUDIO New tool to simplify data loading in Process Copilots (2025-07-31)
The new Load Data tool makes it easier to load data from your Celonis Platform into a Large Language Model (LLM) for review or further processing. This new feature combines the functionality of the existing PQL Tool and Get Data tools into a more intuitive tool that simplifies the data loading process.
Note
Any existing instances using the PQL Tool or Get Data tool will be converted to the new Load Data tool automatically.
The Load Data tool can be set up using one of two configuration methods:
Intelligent: This configuration is comparable to the Get Data tool in that it allows the LLM to use Knowledge Model items to configure the data columns dynamically based on user requests. It is important to note that the Intelligent configuration method does not support dynamic filtering.
Custom: Similar to the PQL Tool, this option allows users to manually define the columns, filters, inputs, and limits for the fixed data load.
For more information see Tool Activation.
TASK MINING Changes to permissions (2025-07-31)
We've made some changes to permissions. Admins can now assign service-level and project-level permissions to analysts.
For more information, see Task Mining permissions.
We've also updated some Task Mining event logs. For the full list, see Audit logs - Event details.
STUDIO Data change detection in Annotation Builder (2025-07-30)
The scheduling functionality in Annotation Builder is getting upgraded with the new "Re-annotate on data changes" option. When this feature is enabled for a scheduled run, Annotation Builder uses AI to detect changes since the last annotation and then processes only the individual rows where the underlying input data has changed. Utilizing this feature saves AI outputs by preventing your Annotation Builder from re-processing the entire dataset each time a row is changed.
With this feature enabled, generating new annotations will be faster since only the impacted rows are processed and it ensures that your annotations will be up to date by automatically re-generating them whenever their source data is changed. Previously, you would have had to manually delete specific annotations and then re-process your entire dataset to ensure the latest data was included.
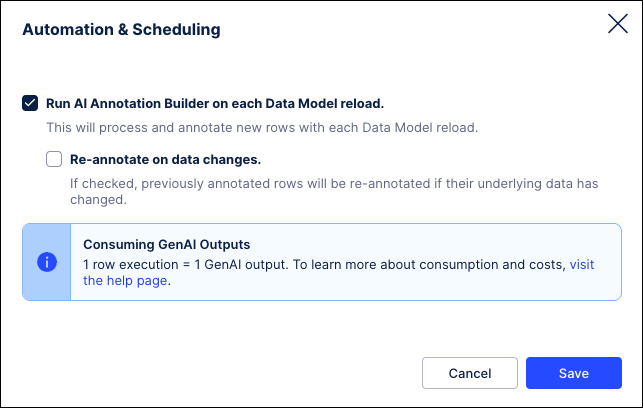 |
For more information, see Running your Annotation Builder.
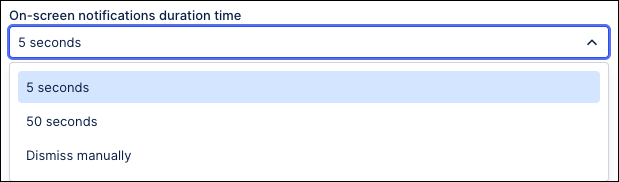
Admin Select duration of on-screen notifications (2025-07-29)
You can now select the duration on-screen notifications appear for when you're using the Celonis Platform.
When viewing your profile management screen, you can select from the following durations:
5 seconds (default)
50 seconds
Dismiss manually
For more information about managing your own profile, head to Managing your user profile.
STUDIO Treemap component for Views (2025-07-28)
You can now add and configure a treemap component for your Studio Views. A treemap component is a type of data visualization that displays hierarchical (tree-structured) data as a set of nested rectangles. Each branch of the hierarchy is represented by a rectangle, which is subdivided into smaller rectangles representing sub-branches or leaves.
In this example, a treemap is used to display the most frequent flight connections between German airports. The darker the color, the higher the number of connections, with MUC to CGN being the most frequently flown during the time period.
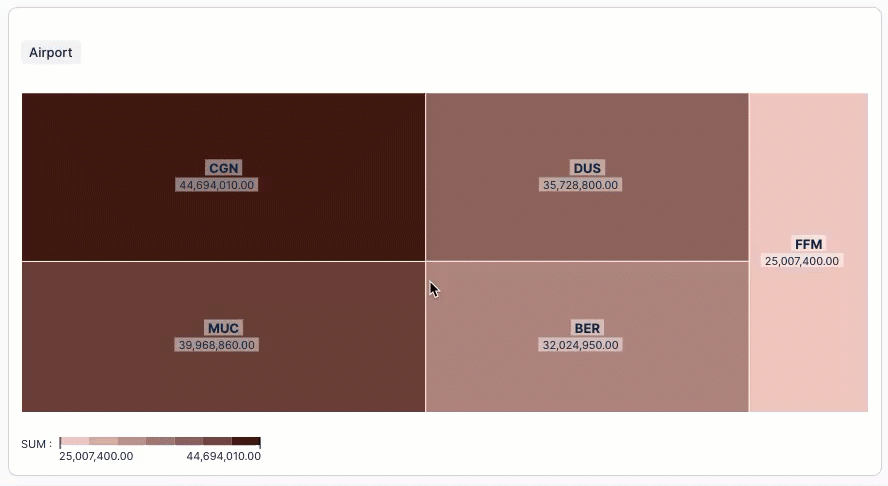
For more information, head to: Treemap.
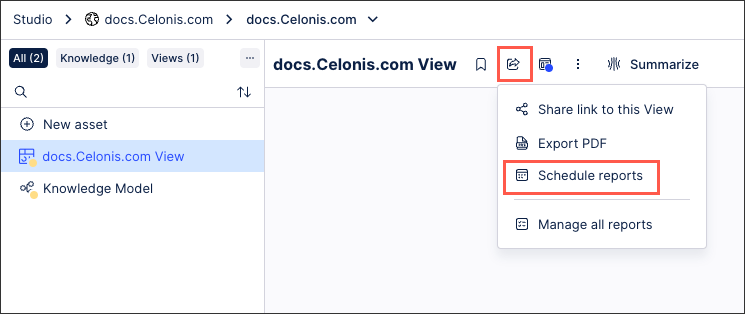
STUDIO Scheduling View reports (2025-07-18)
In addition to manually exporting your Views as PDFs, you can now schedule automated emails to be sent with the View report PDFs attached. These emails can be sent on a daily, weekly, or monthly basis, with the ability to customize the email and the PDF settings for each report.
You can schedule your Studio View reports within a View by clicking Share or export View - Schedule reports:
Once scheduled, your Studio View reports can be edited, permanently deleted, and activated / deactivated depending on its status:
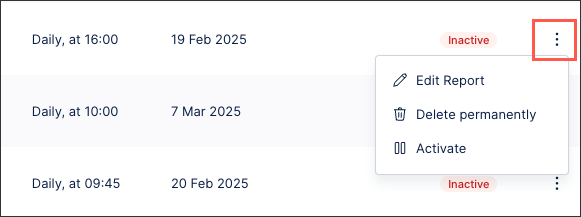
For more information about scheduling View reports, see: View Reports.
STUDIO Build object-centric event logs with visual previews directly in Studio (2025-07-17)
We've created a visual event log builder for you to construct event logs for object-centric process mining perspectives. You don't need to write PQL statements - just choose a lead object and the events you want to include. You'll immediately get a visual preview of your event log, with an event log table, an edge table for connections, and a graph preview.
For more information, see: Event logs (object-centric).

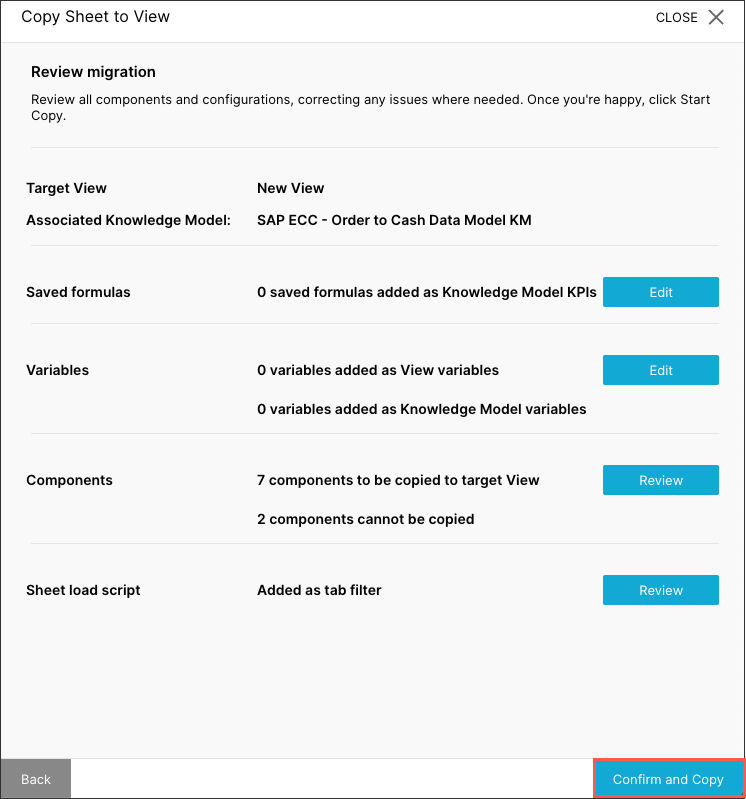
STUDIO Migrating Analysis assets to Views (2025-07-17)
You can now migrate your Analysis assets to Studio Views, allowing you to create dashboards and reports using our enhanced View editing experience. This includes both step-by-step (load scripts, saved formulas, variables, etc.) and full sheet migration options.
Celonis continues to maintain Analysis (by fixing bugs and ensuring that performance remains strong) but no further feature development will take place. As such, we recommend you migrate your Analysis assets to Studio Views.
Step-by-step migration: You can manually migrate individual Analysis assets to Studio Views. Our step-by-step guide explains e.g. how to move load scripts from Analysis to filters in Views, how to copy single or multiple components from Analysis to Views or how to export saved formulas to a Knowledge model. This is especially helpful when you only want to move single parts of your Analysis.
Full sheet migration: Alternatively, if you want to move the full Analysis over to Views, you can use the full sheet migration wizard. This wizard guides you through the migration of a full Analysis sheet (including all components, saved formulas and variables) to a View, saving you from manually exporting each element to the Knowledge Model or View.
For an overview of your migration options, see: Migrating Analysis to Views
 |
STUDIO Legacy View component migration (2025-07-17) - Private Preview
This feature is currently available as a Private Preview only
During a Private Preview, only customers who have agreed to our Private Preview usage agreements can access this feature. Additionally, the features documented here are subject to change and / or cancellation, so they may not be available to all users in future.
For more information about our Private Preview releases, including the level of Support offered with them, see: Feature release types.
You can now migrate select Legacy View components to your Views, allowing you to add and further configure the components using the latest View editor and features.
While in Legacy View edit mode, hovering over a supported component allows you to copy that component (and its configurations) and then paste it into a Studio View. This migration works best when copying between Legacy Views and Views that use the same Knowledge Model, removing the need for you to reconfigure the data.
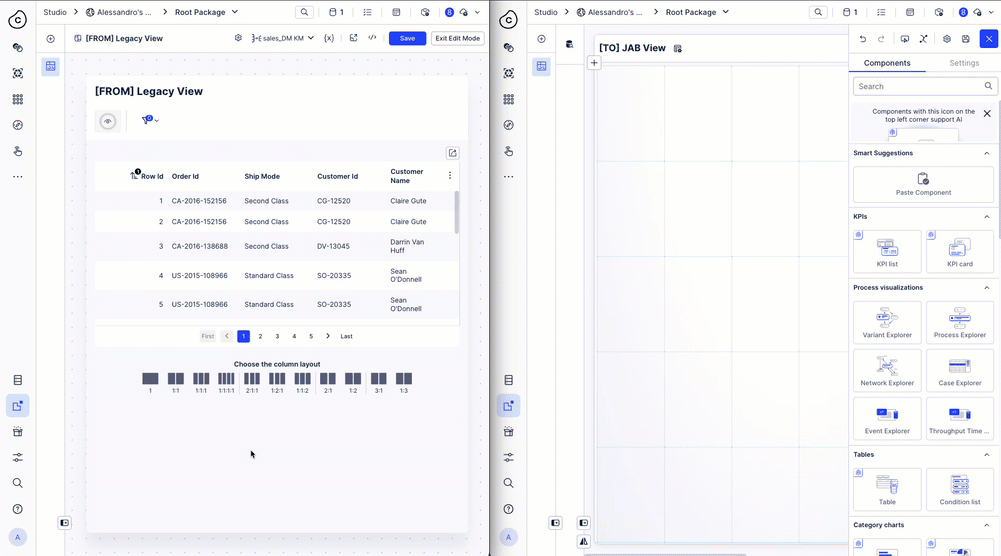
To view the full list of supported components and an overview of current limitations, see Individual component Legacy View to Views migration.
PROCESS NAVIGATOR and PROCESS DESIGNER Activating and configuring live data enhancement (2025-07-16)
We've greatly simplified the process of setting up the live data connection between the Celonis Platform and Celonis Process Management. Administrators can now activate and configure the live data connection themselves through Celonis Process Management. This makes it much easier to set up Process Cockpit for use in Process Navigator.
 |
For more information, refer to the documentation.
PROCESS DESIGNER Best practice task import from PAM (2025-07-16)
When exporting BPMN models from Process Adherence Manager to Process Designer, best practice tasks are now automatically created in Process Designer. The corresponding event ids, as well as further attributes such as team id, pool id and namespace are maintained automatically. This makes the configuration of Process Cockpit easier, as users no longer need to create best practice tasks manually.
For more information, refer to the Exporting BPMN models from Process Adherence Manager.
PROCESS NAVIGATOR Approver role in Process Journal (2025-08-22)
You can now see the Celonis Process Management version number in the profile dropdown.
 |
PROCESS NAVIGATOR Submit request on task level (2025-07-16)
Users with the Viewer role in Process Navigator can now submit requests based on a specific task in the Navigator. The request will display in the Action Center, with a link to the task the request is based on. Previously, users were only able to submit a request at the subprocess level, which was not precise enough.
 |
 |
For more information, refer to the documentation.
PROCESS NAVIGATOR and PROCESS DESIGNER SSO configuration enhancements (2025-07-16)
We've enhanced our Single Sign-On (SSO) feature to be more intuitive. When admins set up SSO for the first time, the form will now autofill the service provider URL. We've also added a reminder encouraging admins to switch off the standard login method as a final step in configuring SSO. This helps admins in streamlining their end-users login experience and adopting a better security practice.
 |
For more information, refer to the documentation.
PROCESS NAVIGATOR Language indicator moved to top navigation (2025-07-16)
We've moved the language indicator to the top navigation. This makes it much easier for users to see and change the language for their workspace. Previously, they had to click into the Profile dropdown to access this setting.
 |
For more information, refer to the documentation.
PI GRAPH New Versioning functionality in the Process Intelligence Graph (2025-07-15) - Private Preview
This feature is currently available as a Private Preview only
During a Private Preview, only customers who have agreed to our Private Preview usage agreements can access this feature. Additionally, the features documented here are subject to change and / or cancellation, so they may not be available to all users in future.
For more information about our Private Preview releases, including the level of Support offered with them, see: Feature release types.
The new PI Graph Versioning functionality allows you to manage your releases more effectively and improve the collaboration between different teams within the Celonis Platform. Versioning will provide greater control over your object-centric data model changes by allowing version creation, tracking, and targeted deployment all from within the Objects & Events module. From the Versions screen, you will also be able to track and manage changes between versions and rollback changes that have been released to production to a previous version.
This new Versioning functionality provides you with:
OCDM Versioning: Used to create structured versions of types, transformations, and perspectives for consistent and traceable model updates.
Change Tracking: Instantly see all changes since the previous version to simplify reviews.
Staged Deployment: Deploy to development and production environments separately for safer and more controlled rollouts.
STUDIO Divider component added to Views (2025-07-15)
You can now add horizontal and vertical dividers to your Studio Views, allowing you to visually separate sections and improve your content hierarchy within your View.
In this example, horizontal dividers have been used to visually separate different View components:
To learn more about creating Views, see: Views.
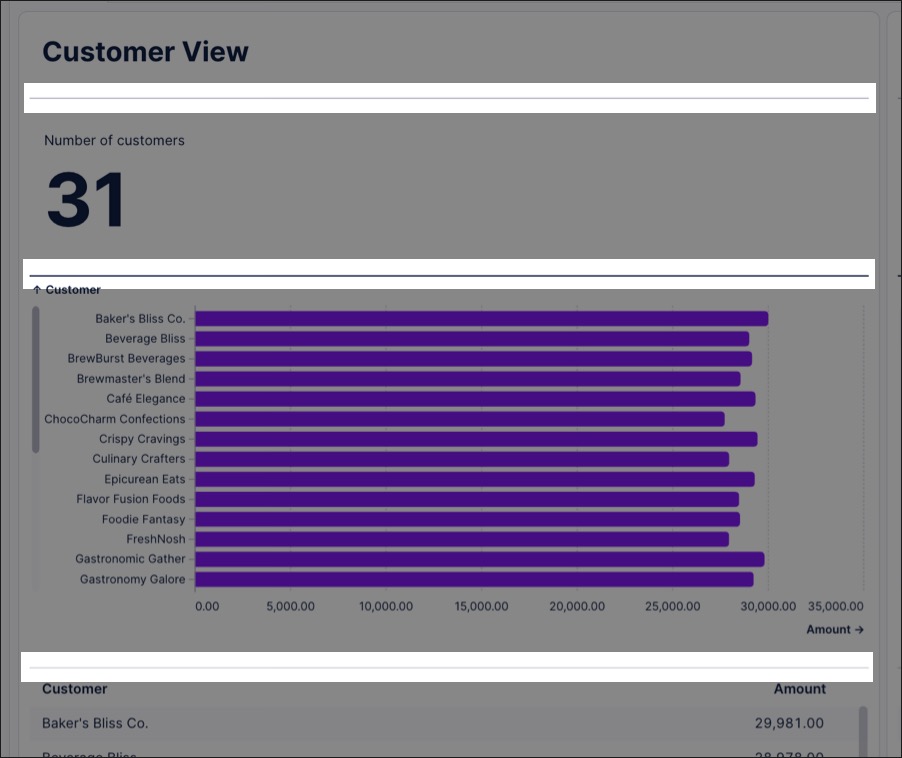
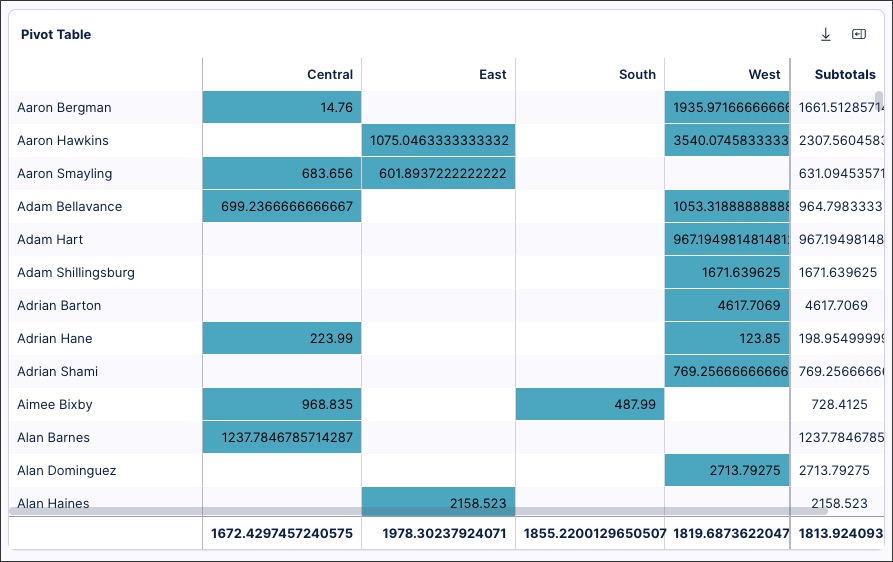
STUDIO Pivot table component for Views (2025-07-14)
You can now add a pivot table to your Studio Views, allowing you to summarize, analyze, and present large datasets without altering the original data.
In this example, a pivot table is used to display customer sales information based on regions. Each cell represents the average sales per customer in that region, with their customer and region subtotals displayed. Any cells with a positive value are then colored, making the table easier to read.
To learn more about pivot tables, see: Pivot table.
STUDIO Copying filters between Views (2025-07-14)
Any filters you set in a View can now also be copied into other Views within your Celonis Platform team, saving you from manually configuring them each time. Copied filters are saved on a clipboard for 10 minutes, with a prompt for you to apply the filter when you open subsequent Views.
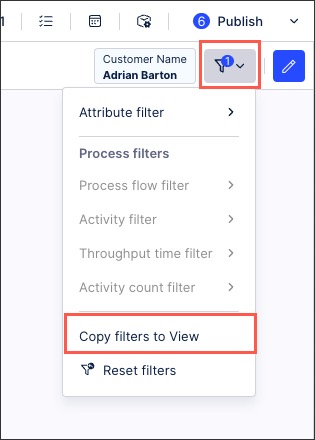
To learn more about copying filters between Studio Views, see: Filtering Views.
PI GRAPH Extend custom object types from source system tables (2025-07-10)
As an alternative to importing a complete object type from a table in your source data, you can now use a source system table to extend a custom object type that you've started to model. If you're modeling iteratively, this is a good way to complete your initial objects after validating them with stakeholders.
You can select columns from the table to become attributes of the custom object type, and you can map columns to attributes that you already modeled. If you didn't create transformations yet for the object type, a SQL transformation script will be generated automatically that populates the attributes you imported or mapped. You can repeat the process with other source system tables to add more attributes to the object type, though the transformation script will only be generated once.
STUDIO Data health checks in Process Copilots (2025-07-09)
Celonis now performs automated scans to check your Knowledge Models for potential issues such as missing descriptions, schema changes, duplicate entries, outdated attributes, and other problems that could confuse the Large Language Models used in your AI tools such as Process Copilot. Resolving these issues will prevent your AI tools from analyzing inconsistent or incomplete data which can impact the quality of your outputs. Properly configuring your data will improve the accuracy of your responses and provide more reliable results.
The findings from these scans are displayed in the Knowledge Input section of the Process Copilot configuration screen. Each impacted knowledge item is displayed as a separate line with a description of the problem and a link to access the impacted item directly in the Knowledge Model. Hover over the warning or error icon in the Issues column to see the cause of the problem and then select the Click to edit link to open this knowledge item in the Knowledge Model.
 |
For more information, see Knowledge Input in Process Copilots.
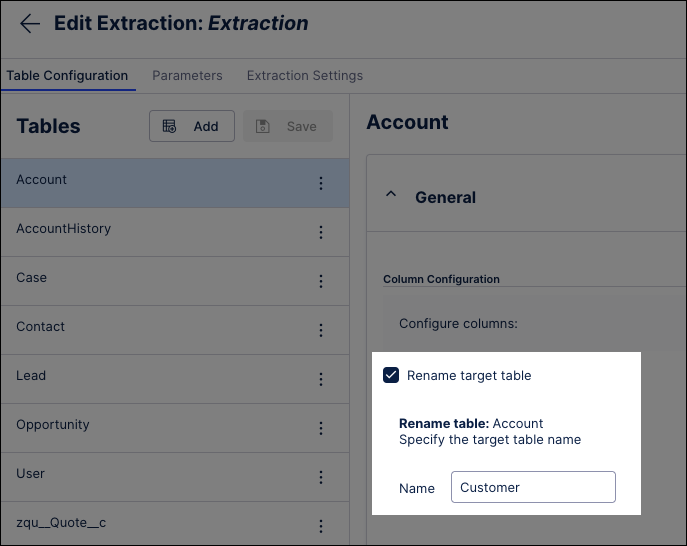
DATA INTEGRATION Renaming target table in cloud extractions (2025-07-08)
You can now rename the target table in the Celonis Platform when extracting data from a cloud based source system such as SAP Ariba, Salesforce, and Oracle Fusion Cloud.
When creating extraction tasks, select Rename name target in the Table Configuration settings and then specify the table name:
For more information about connecting to cloud based source systems, see: Applications.
And for information about creating extraction tasks, see: Creating extraction tasks using the visual editor.
STUDIO Smart inputs added to View and component fields (2025-07-08)
We've enhanced the text field inputs in Studio Views to suggest variables, translations, and JavaScript when inside the “${}“ syntax. When typing in supported text fields, smart inputs give you auto complete suggestions from existing queries in your package. You can then click on the suggestion or use the arrow keys and hit Enter to add it to your expression.
For example, a smart input is used in the tab name to display the current date:
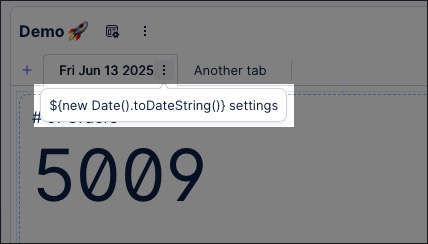
This is configured using the following smart input:
${new Date().toDateString()}For a video overview of smart inputs in Views:
Smart inputs are enabled for the following Studio features: Button label, Button variant, Color Mapping (View Components), component information, filter dropdown label, input box label, input dropdown label, tab Container, tab name, and View name.
For more information smart inputs, see: Smart inputs.
STUDIO Activity / Event node coloring in Process Explorer and Variant Explorer (2025-07-07)
Process Explorer and Variant Explorer are being upgraded with the ability to add custom coloring to the activity and event nodes in the process graph. This new feature allows users to design and select custom color schemes that can be applied to the nodes in their process graph. For example, users can choose to color specific events or activities based on the department responsible or they can color any nodes they want to monitor in red as an alert. In the examples below, the nodes for the “happy path” have been set as green.
|  | |
Case-centric Process Explorer | Multi-object Process Explorer |

These custom color options can be applied in edit mode by selecting a mapping from the Coloring section on the Settings tab. The color mapping can be removed for the component by clicking the Reset to default link and restoring the default colors to each node.
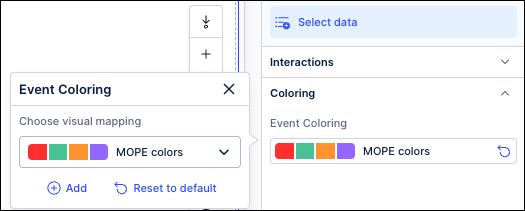
To create a new mapping, click Add in the Event Coloring section and then use the Add Visual mapping window to assign colors to the relevant events or activities. Select an event or activity from the Categories dropdown and then click the colored square to the left to choose which color to assign to that node. Click the Add link to select more events or activities to assign colors to and then click Save when finished.
Note
The Not Mapped section lists the events and activities that have not yet been mapped to a color. Users can also disable the toggle switch to retain the default event log colors for these unmapped events.
 |
For more information, see Color mapping event nodes.
BUSINESS APPS Payment Terms Harmonizer app release (2025-07-07)
A new version of the Payment Terms Harmonizer app is available. This release includes the new Value Tracking view, located in the Value Journey folder, which enhances value framing. For more information, refer to:
Note
To add the Value Tracking view in Payment Terms Harmonizer, you must update the app configuration. For more information, refer to Prerequisites for the Payment Terms Harmonizer app.
TASK MINING Create Business Events by adding business context to captured user activities (2025-07-03) - Private Preview
This feature is currently available as a Private Preview only
During a Private Preview, only customers who have agreed to our Private Preview usage agreements can access this feature. Additionally, the features documented here are subject to change and / or cancellation, so they may not be available to all users in future.
For more information about our Private Preview releases, including the level of Support offered with them, see: Feature release types.
We've added a new user interface that lets you group user activities captured in Task Mining and add business context to create semantically-meaningful Business Events. Adding these Business Events to process graphs provides clearer and more granular process visualizations, without overwhelming 'click-level' detail or writing complex SQL queries.
For more information, see Business Events.
MACHINE LEARNING o3-mini is now available for Azure OpenAI (2025-07-01)
The o3-mini reasoning model is now available on the Celonis platform for the Azure OpenAI provider. Unlike standard LLMs that generate direct answers, o3-mini breaks down queries into a sequence of reasoning steps to form its response. This enables it to handle tasks that require multi-step analysis, making it a powerful integration for applications such as the Annotation Builder.
The o3-mini model also improves prompt adherence, which is especially useful when your use case involves following specific rules or guidelines, such as applying a business policy. This allows you to address more detailed, multi-step scenarios, and build AI-powered solutions with more consistent behavior. By designing prompts that include detailed instructions and business logic, you’ll see better adherence to your specified rules. This makes it easier to automate workflows with strict requirements that may have been difficult to implement before.
To integrate o3-mini in the Azure OpenAI provider in applications, an administrator must first enable it in Admin & Settings > AI Settings. For more information, refer to Enable AI provider models. Once enabled by an administrator, you can select o3 Mini (Azure OpenAI) in the model dropdown menu within consuming applications, such as the Annotation Builder.