Using with the process model
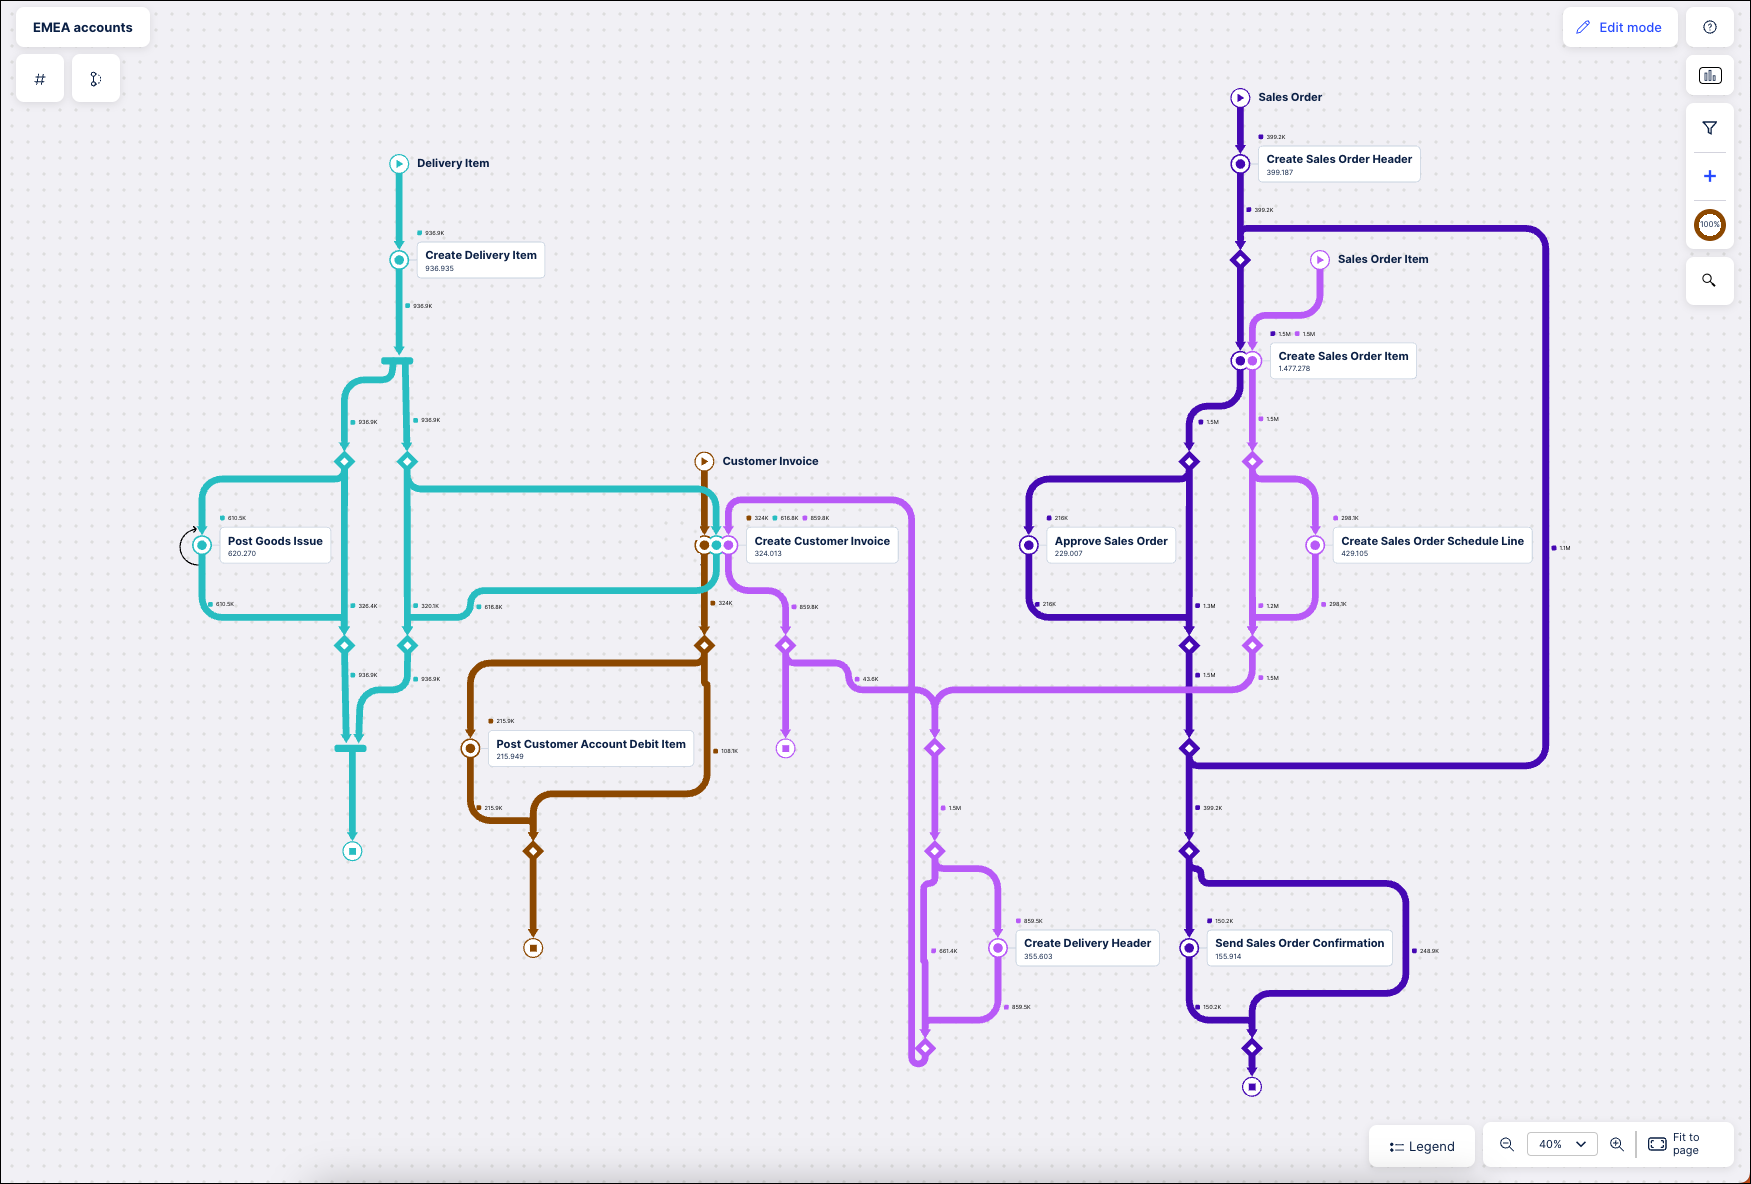
The Process Adherence Manager shows a complete overview of your process model using a layout that resembles a subway map. Each subway line represents a specific event log and is displayed in a different color so you can easily differentiate between them. Each stop on the subway line is a specific event within that process, with multiple lines potentially meeting at the same stop.
The data included in the process model is based on the events selected when creating the model. You can customize the information shown in the model further by applying filters.
 |
There are two modes for working with process models in PAM, View mode and Edit mode. By default, models are in View mode.
In View mode, you can:
Report on data within the process model but cannot change it.
Add filters to set which events are shown in the process model.
You access Edit mode by clicking Edit mode in the top right of the screen. In Edit mode, you can:
Mine your baseline model.
Add or remove specific event logs and events in the process model.
Select variants.
View and change the knowledge model used.
Note
Any changes you make will display in real time in the process graph. Any changes you've made to the process model since you created the target model will be discarded. While you’re modifying an asset, the Edit mode button is disabled for other users. If another user opens the asset in View mode, they’ll see a message indicating that you’re currently editing this asset.
Before you begin
Before you begin, ensure you have completed the following steps or meet the requirements listed below:
Created a baseline model in PAM
Working with CPM model versions in PAM
If you created your target model by importing a BPMN model from CPM, you may want to know which version of the BPMN model you used and whether it's still the latest version available.
To work with CPM model versions, follow these steps:
Open a target model that was created by importing a BPMN file from CPM.
In Edit mode, hover your cursor over Target Model.
Information about your model appears.

If the model status is:
Valid, the BPMN model used to create your target model in PAM is still the latest version in Process Designer and no further action is required.
Invalid, the BPMN model used to create your target model in PAM has been updated in Process Designer and action is required; see step 4.
Select the triple-dot button.
The options available appear.
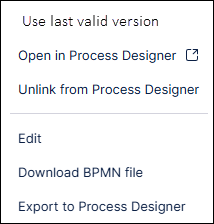
Select:
Use last valid version to use the lastest version of the model from Process Designer; if any new activities have been added, you'll be prompted to map them to your event logs.
Open in Process Designer to view your current target model in Process Designer.
Unlink from Process Designer if you don't want your current target model to be connected to the Process Designer model.
Searching the PAM process model
To search the process model, follow these steps:
Click the Search icon to the right of the process model graph.
Enter your criteria in the Search field.
As you enter your search criteria, any events logs and events matching your criteria are displayed, with the colored squares indicating which event log the event appears in.
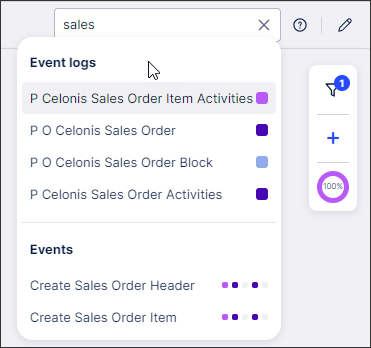
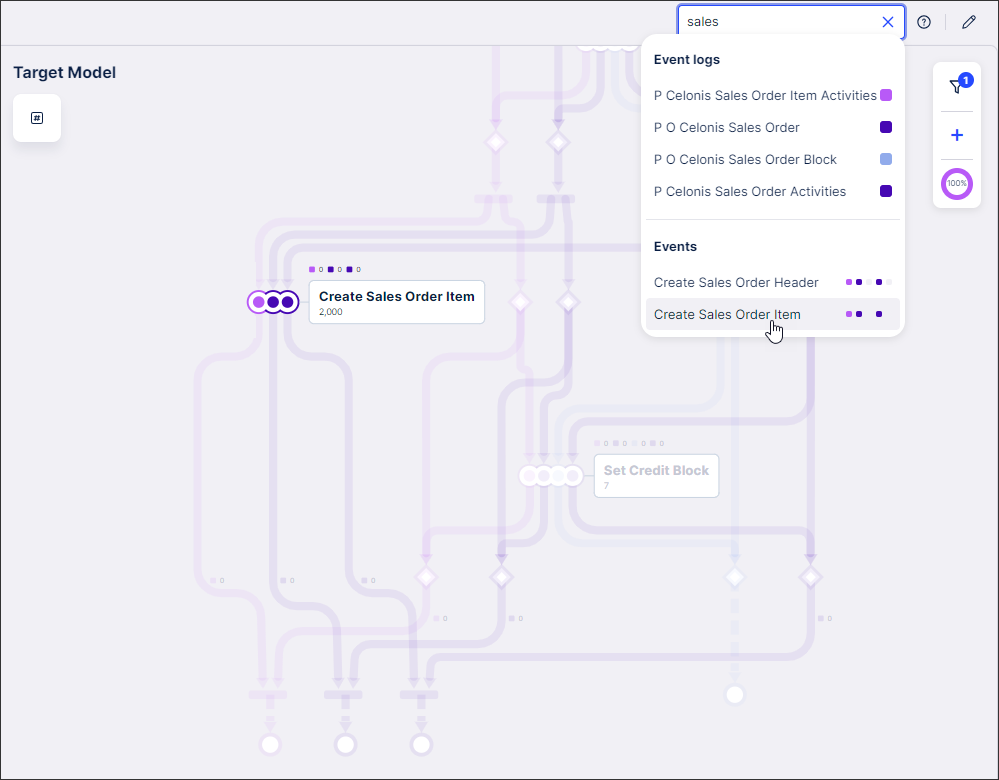
Click any search result to go directly to that event in the process model.
Changing the metrics displayed in the process model
To change the metrics displayed, follow these steps:
Click the metric button in the upper left corner to open the metric switcher.
Note
The icon for the metric switcher varies according to the metric that is currently selected. If Thoughput time is selected, for example, a stopwatch icon displays.
Select the metric you want to use from the dropdown.
The metric displayed on the edges and events within the process model and the units used are updated automatically.
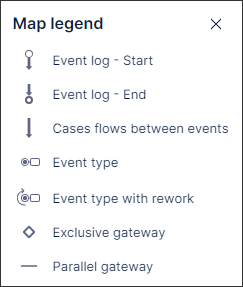
Using the map legend
The map legend explains what the different shapes, lines and icons used in the model mean. Click Legend in the lower right corner of Process Adherence Manager to view it.
 |
Event icons in the process model graph
Icon | Name | Description | |
|---|---|---|---|
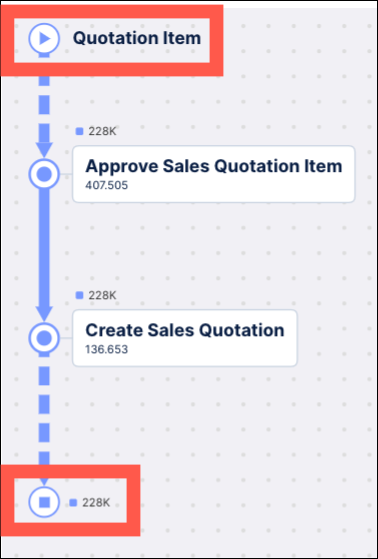
| Event Start/Event End |
| |
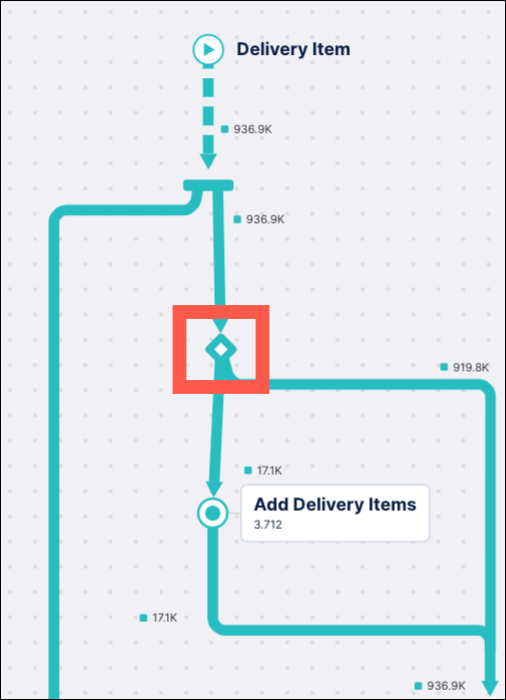
| Exclusive split | The diamond icon indicates an exclusive split of the event flow. This indicates only one of the outgoing paths is taken. | |
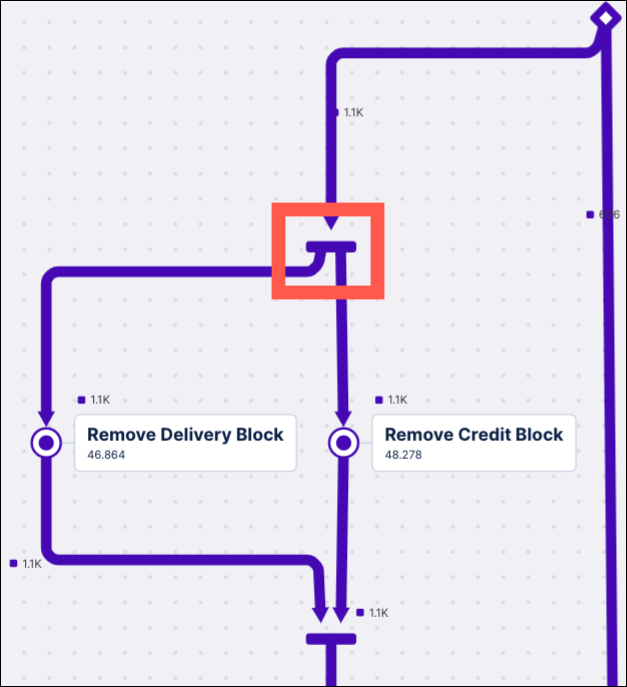
| Parallel Gateway | A horizontal bar (parallel gateway) indicates parallel behavior. All the ongoing paths are taken but their order can differ. All incoming paths join at the gateway before the next events occur. | |
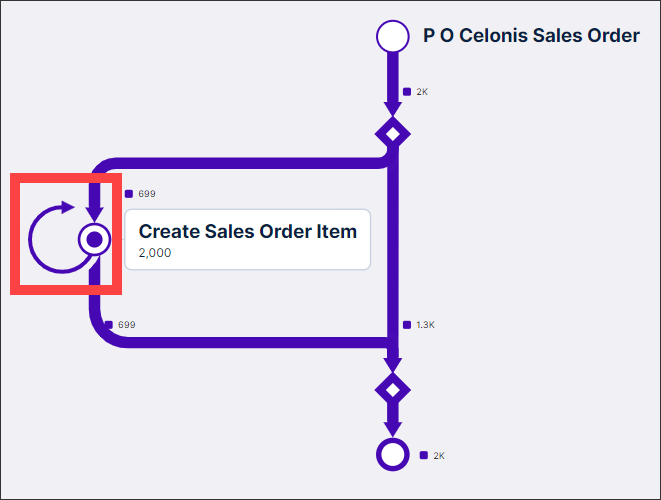 | Self-loop | A looping arrow in an event log indicates a self-loop. The looping arrow has the same color as the event log it occurs in. If a self-loop occurs in multiple event logs, mutiple looping arrows matching the event log colors will display. |