January 2026 Release Notes
January 30, 2026
PRIVATE STUDIO Reusing View modules across packages
With this Private Preview release, you can now use View modules across different Studio packages.
Previously, you could only reuse modules within your own package. This new functionality gives increased flexibility by allowing View module reuse across packages. Published changes to the reused View Module can be updated as required.
For more information, see Reusing View modules across packages.
January 29, 2026
NEW PROCESS DESIGNER LeanIX/CPM integration
We've released an integration that allows you to pull data from LeanIX and use it within Process Designer. You can access this integration via the Celonis Marketplace.
For more information on how to set up the integration, refer to LeanIX - Celonis Process Management integration.
NEW STUDIO Dimension switching in charts
Dimension switching enables faster, more flexible self-service analysis, allowing users to explore multiple data perspectives within a single chart for quicker insights and a better experience.
Users can now dynamically adjust the data in bar, column, line, and area charts by enabling dimension switching.
Previously, users couldn't easily switch between visualizing data on a weekly and a monthly basis.
With dimension switching, users can now change the data perspective displayed using a simple dropdown in the chart.
In this example, the user can select whether to display the Sum data by Ship Mode, State or City.
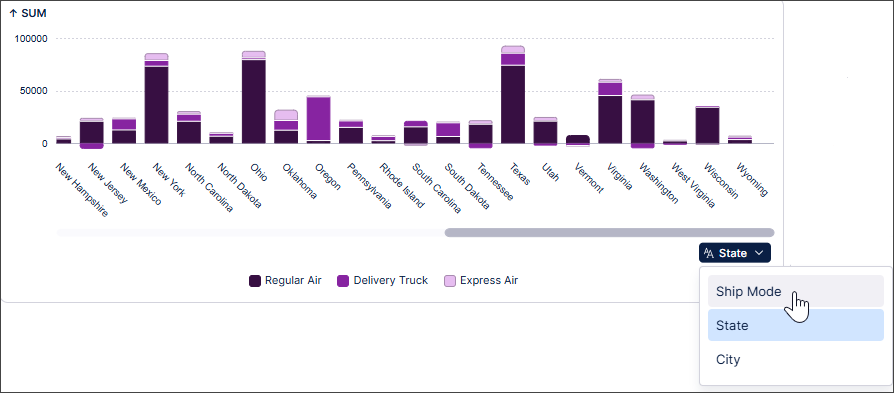 |
To find out more, see Switching dimensions in charts.
IMPROVED STUDIO Unifying Internal and External Process Copilots
The process for creating Process Copilots is being simplified by removing the need to specify between internal and external assets on the Create Process Copilot screen. Instead, all Process Copilots will have the option to be enabled for external use and you will be able to send both internal and external calls from the chat interface.
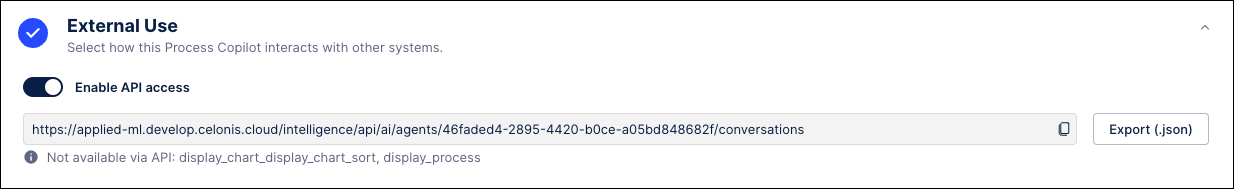
To make your Process Copilots externally available, you will enable the toggle switch in the new External Use section of the configuration screen to activate this asset for external API access. Once enabled, you can either copy the URL for the API or export the JSON code to use with your external tools. Any tools in this Process Copilot that are not available via API will be listed below the API URL field.
Note
Calls made using the external API will display on the Process Copilot Monitoring screen with a location of “External API”.
Any existing Process Copilots that were created to be external assets will be migrated to the new format automatically. All existing APIs will remain unchanged and the external API access for these assets will be enabled by default to ensure they continue to function.
For more information, see Creating Process Copilots.
January 28, 2026
IMPROVED STUDIO Usability enhancements for asset-to-asset dependencies
We've made a couple of small usability enhancements to asset-to-asset dependencies in Studio.
You can now drag and drop the asset dependencies modal, giving you greater flexibility about how Studio is displayed. You can also filter dependencies by asset type.
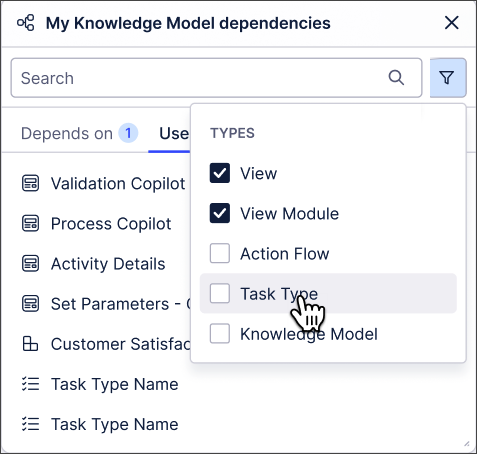 |
For more information about asset-to-asset dependencies, see Asset-to-asset dependencies.
January 26, 2026
IMPROVED STUDIO New AI-generated inefficiency metrics in Insight Explorer
Insight Explorer is getting upgraded to use AI capabilities to detect process inefficiencies within your event logs. These AI-generated metrics can be selected from the new Metric Recommendations section on the Metrics tab of your Insight Explorer configuration, allowing you to select pre-configured metrics that don’t currently exist in your Knowledge Model. Just select an event log and AI will generate process inefficiency metrics based on the selected event log that can be added and analyzed in Insight Explorer.
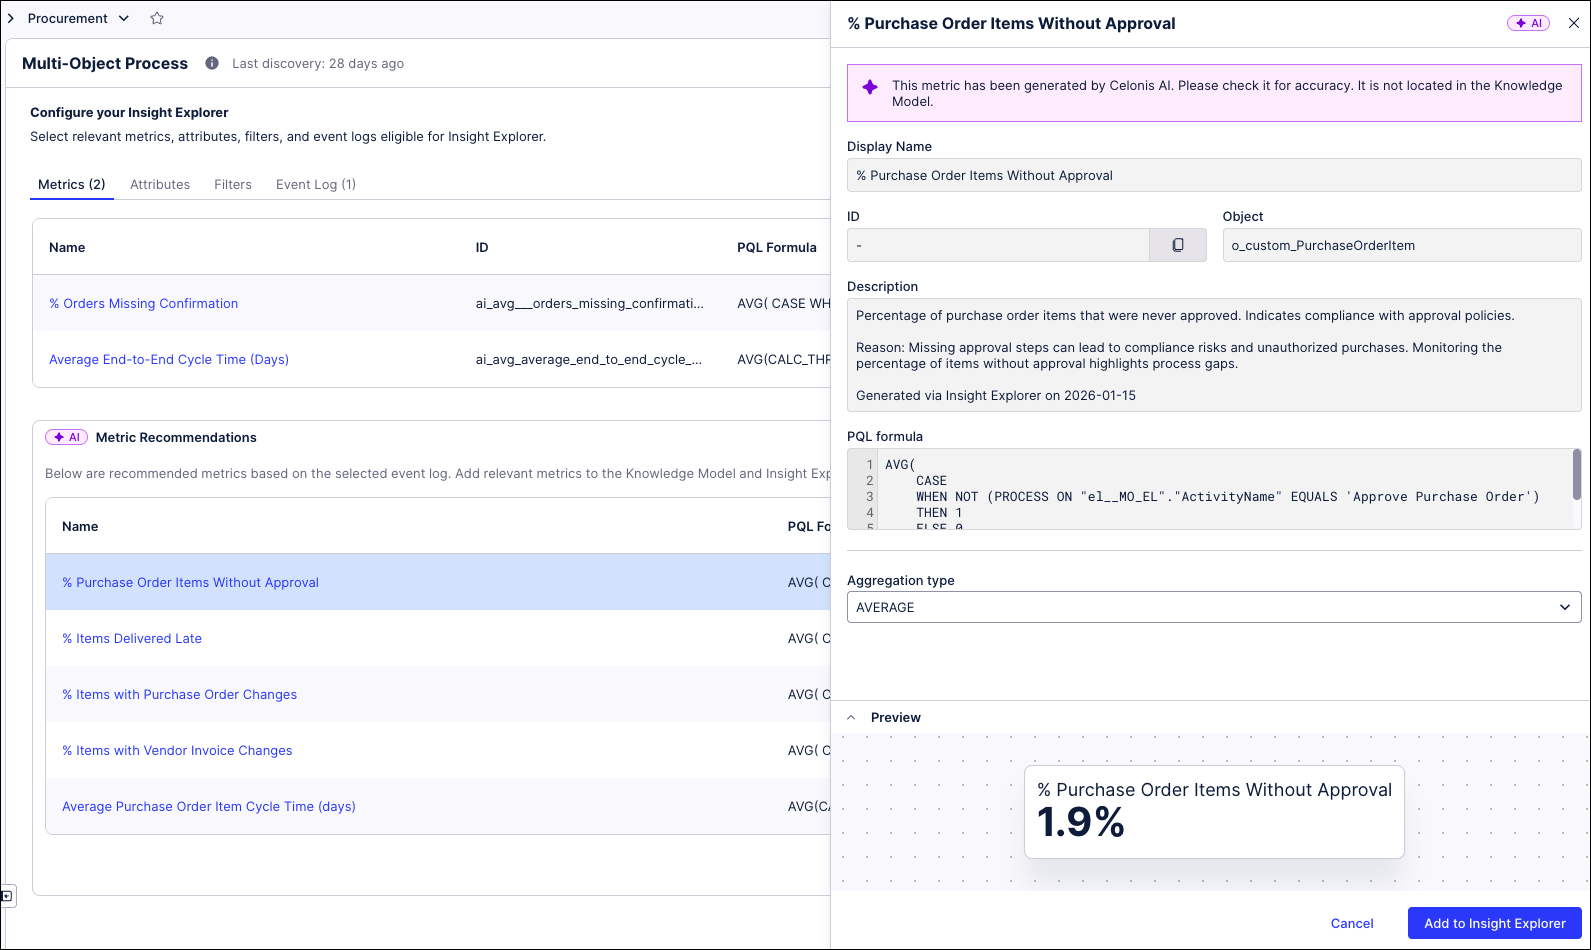 |
To add one of the recommended metrics, click on the metric name to view the details and then click the Add to Insight Explorer button to add this metric to your configuration. Insights can then be generated to deep dive into those process inefficiencies.
For more information, see Configuring an Insight Explorer.
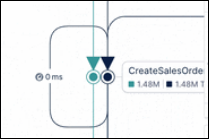
IMPROVED STUDIO Layout upgrades to the multi-object Process Explorer graph
In order to reduce the perceived complexity and increase the understandability of the Multi Object Process Explorer (MOPE) graph, a number of improvements are being introduced to the process graph layout and performance, including:
Highlighting of new elements - When adding events or connections, the updated portion of the graph will be highlighted to show what was added.
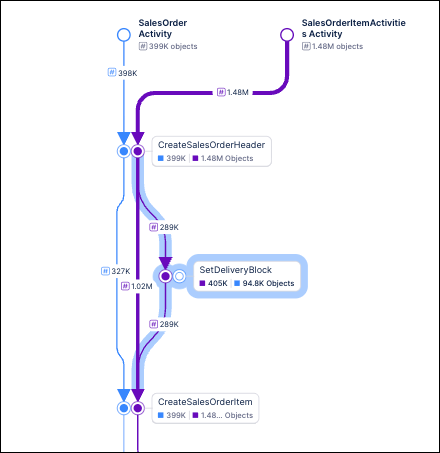
Larger arrowheads - The arrowheads on the process graph are now larger, making it easier to quickly identify the direction of edges. This change is especially helpful when viewing larger or more complex graphs.
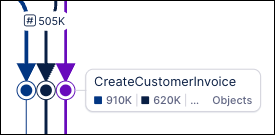
Reduced zooming - When using the slider controls to add or remove events or connections from the process graph, the current level of zoom is maintained. For example, if you are viewing your process graph at 75% zoom and then add new events or connections, the graph will update but remain at 75% zoom. Previously, the graph would zoom out to show the entire process each time it was updated.
Improved connection routing - Makes it easier to identify loops and keeps the process graph more compact.
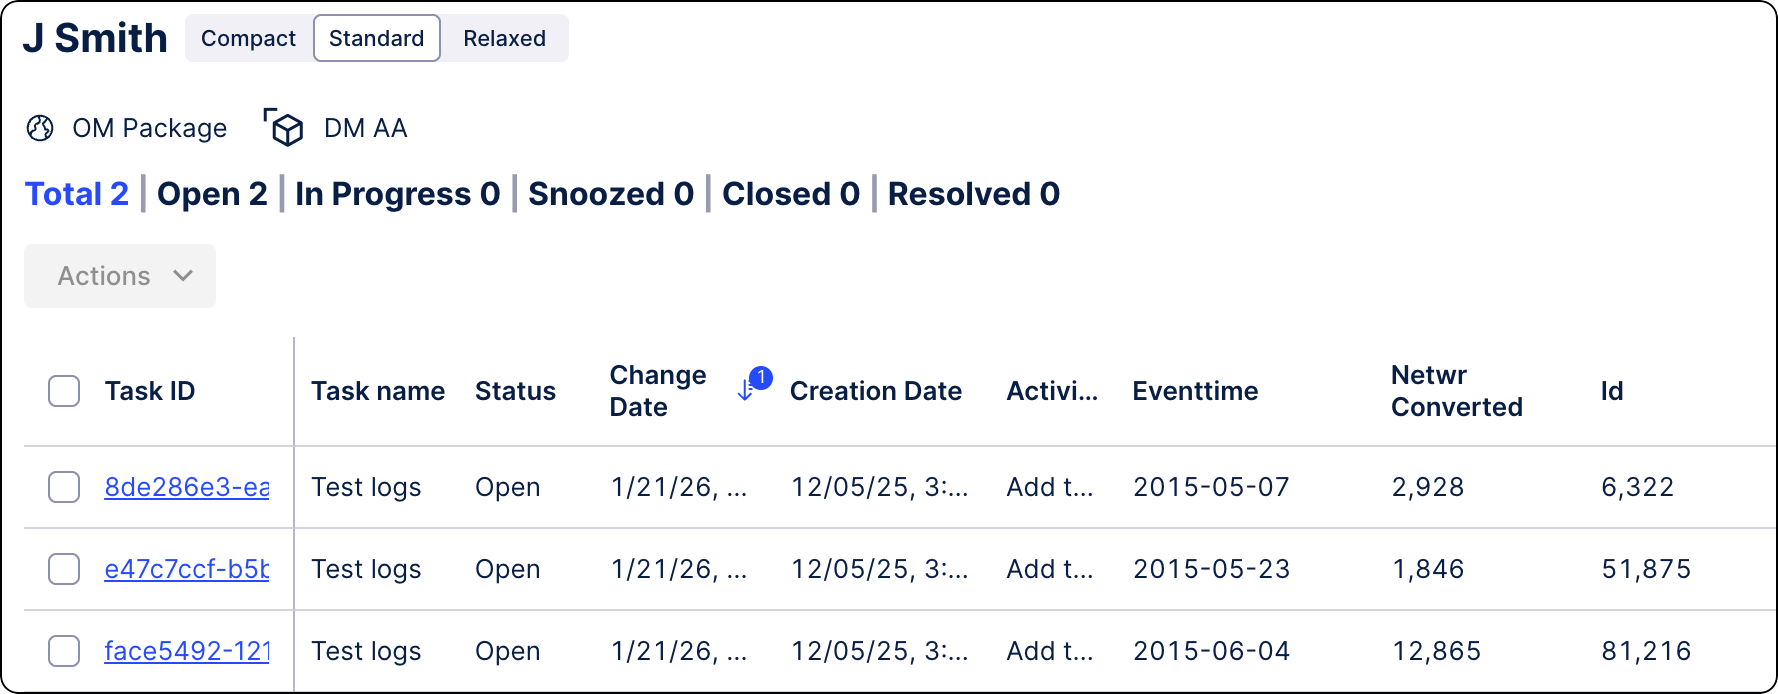
NEW BUSINESS APPS Data Model Tasks included in Inbox
The Tasks Inbox now includes Tasks triggered from Data Models (identifier-based), alongside existing record-based Task. This ensures that all tasks raised for users across Celonis Platform are accessible in one centralized location. For more information, see Inbox.
IMPROVED DATA INTEGRATION Enhanced and refreshed SQL editor
When creating or editing SQL transformation jobs, you can now use the enhanced, refreshed SQL editor by default. Previously available in our Objects and Events product area, this editor builds on the existing feature set while providing a more consistent experience across the platform.
In addition to searching existing statements, browsing tables from your data sources, and creating parameters, you can now open and work with multiple transformations at the same time:
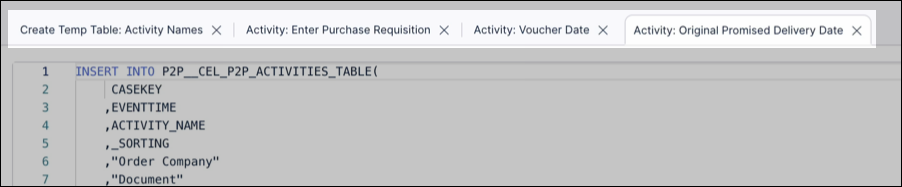
While the enhanced SQL editor loads by default, you can also return to the previous experience by clicking Old SQL editor within a transformation:
To learn more about creating transformations, see: Extracting and transforming data.
January 23, 2026
NEW STUDIO New KPI visualization component in Views
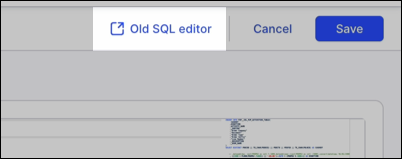
We've added a new View component called KPI meter.
The KPI meter component displays the current value of a metric on a bullet chart, with color coding indicating different KPI thresholds. You can customize the threshold values and colors used in the bullet chart.
In this example, a dashboard contains KPI meter components that display KPIs related to orders. The color customizations of the different thresholds give a clear visual indicator of how the actual KPI data compares to the defined threshold values.
 |
In addition, the KPI meter component supports the migration of Analyses that use these Single KPI components:
Fill.
Radial.
Gauge.
For more information, see KPI cards and KPI lists.
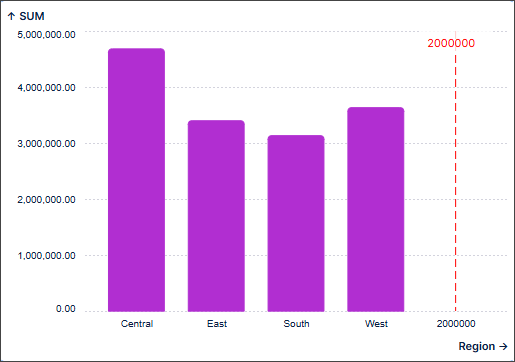
FIXED STUDIO Annotation lines filtered out in charts where domain mismatch exists
We've fixed an issue with annotation lines in charts that have discrete scales.
Annotation lines give extra context to Studio charts indicating, for example, previous data values or overarching trends. However, adding annotation lines that don't match the domain of the axis can cause display issues with scrollable charts without adding useful context.
With this fix, annotation lines that don't match the domain of the axis are automatically filtered out and no longer display in Studio charts.
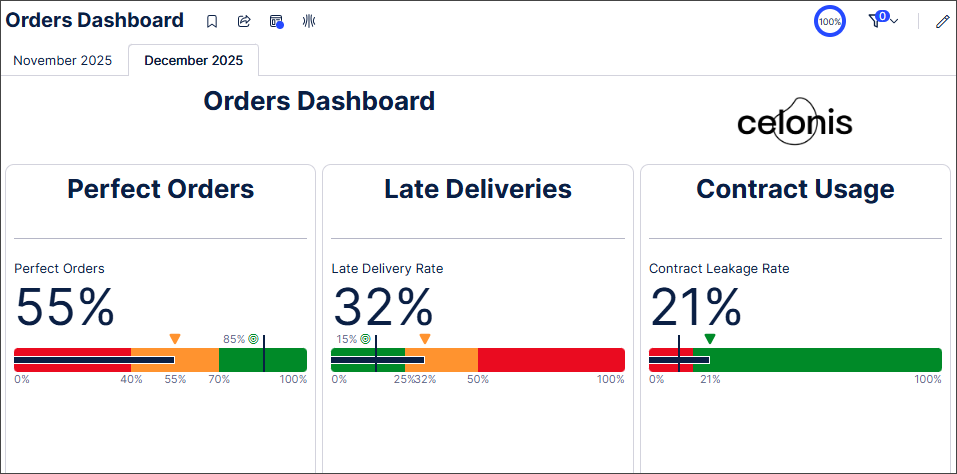
In these examples, the annotation lines match the domain of the axis so will display in the chart.
 |
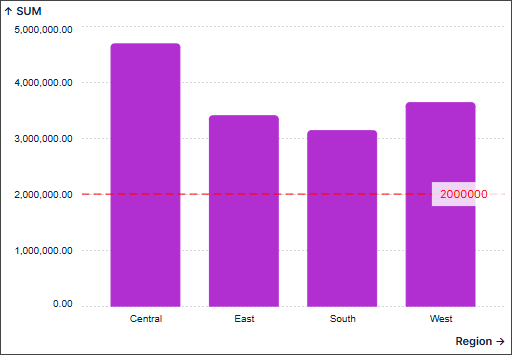 |
In this example, as the annotation line does not match the domain of the axis, it is filtered out and does not display in the chart.
 |
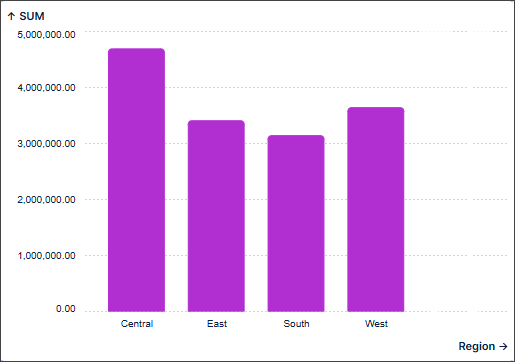 |
Annotation lines will always display in charts with continuous scales, such as those representing time.
For more information about charts in Studio, see Charts.
January 22, 2026
IMPROVED STUDIO Group package assets
You can now group Studio package assets by type, functionality, or custom criteria. You can also sort each group and create new asset types directly within it.
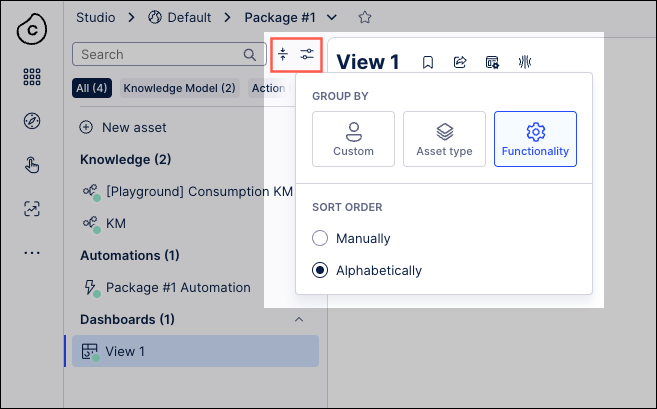
To learn more about managing your Studio package assets, see Managing packages and permissions.
PUBLIC PREVIEW OBJECTS AND EVENTS Objects and events assets added to team-to-team copy
With this public preview release, you can now copy your object-centric process mining (OCPM) data models (OCDM) and data pools between Celonis Platform teams using the Team-to-team copy feature. This feature also team admins to select the team to copy assets into (known as the target team), check and resolve asset dependencies, and run the copy.
When copying Objects and Events assets, the following applies:
Object-centric process mining (OCPM) data pools are always copied together with their OCDM configuration; copying OCDM alone is not supported.
The OCDM version deployed to production in the source data pool is copied. Individual OCDM assets (objects or events) cannot be copied.
A successful team-to-team copy creates a new OCDM version in the target team, but it is not automatically deployed.
Data pools can be copied to an existing or new data pool in the target team. Once established, this mapping is permanent.
When copying to an existing target data pool, the OCDM version history is reset to 0.0.1 on the first copy.
For more information about the team-to-team copy feature, see: Team-to-team copy.
January 21, 2026
NEW STUDIO Control analyst access to Annotation Builder, Insight Explorer, and Process Copilot assets
With this release, admin users can now control which analysts can access, view, and edit Annotation Builder, Insight Explorer, and Process Copilot assets. This change creates an additional level of protection against unintended or negative consequences related to their use.
For more information, see the documentation for Annotation Builder, Insight Explorer, and Control analyst access to Process Copilot assets.
Note
This functionality is only available upon request. To enable it in your environment, contact us at Celonis Support.
January 19, 2026
IMPROVED STUDIO Exporting linked Views as PDF
In addition to exporting a main View as a PDF, you can now export a linked View while in view mode, either in Studio or in a published app. This enhancement lets you create shareable, offline versions of your data outside the Celonis Platform. You can also select multiple tabs, add page numbers, and adjust the PDF scale and orientation.
To export your Studio View or linked View as a PDF while in view mode (in Studio or Apps), click Share - Export PDF:
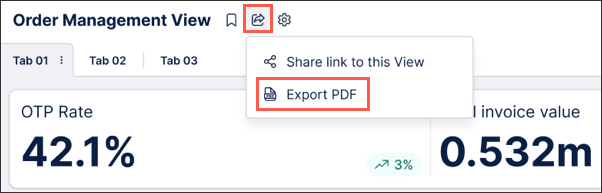
To learn more about exporting your Studio Views, see: Exporting Views.
January 15, 2026
NEW STUDIO Stacking and grouping metrics across dimensions for bar and column charts
You can now quickly and easily split bar and column charts in Views across dimensions, letting you create stacked or grouped charts that adapt seamlessly to your data and provide accurate and meaningful data visualization.
Previously, creating stacked/grouped bar and column charts involved stacking/grouping multiple metrics and manually defining each stack or group in the bar or column chart individually. This required significant effort for larger data sets and was impractical when dealing with dynamic data as multiple metrics needed to be added and maintained.
This new feature lets you select which metrics are used to stack or group your data, set the ordering to ascending or descending and define how many stacks or groups are displayed (maximum of 20). You can also limit the number of data points displayed in the chart overall in the Data Settings section of the chart component which is useful when working with large data sets. In addition, you can choose the display colors for the different dimensions within each stack or group.
In this example, the bar chart displays multiple product sub-categories, with the stack length indicating the total sales for each product sub-category. Setting the Split by option to Ship Mode displays the number of items shipped by each shipping method for each product sub-category, as well as the average sales for each shipping method. Changing the colors used to display the different shipping methods aids visualization.
For more information, see Data dimensions and metrics.
IMPROVED STUDIO OBJECTS AND EVENTS Versioning and deploying packages to replace publishing workflow
We’ve replaced and upgraded the publishing workflow in Studio and Objects and Events with a new versioning and deployment system, giving you greater control over your content. Initially released in public preview, these features allow you to create and manage package and data models versions, track changes, deploy to development and production environments, and efficiently roll back to previous releases.
Studio: Studio lets you deploy packages and control which versions of packages and assets App end-users can access. With version control and support for multiple package versions, you can test new features and configurations before roll out, and offer different App versions for specific use cases via duplicating the package (e.g., locations, products, or teams).
To learn more, see: Versioning and deploying packages.
Objects and Events: Use versioning and deployment capabilities to create, test, and release numbered versions of your object-centric data models. You can deploy to development or production data pools and review or reload earlier versions at any time.
To learn more, see: Versioning and deploying OCDM.
For a video overview of these features:
January 13, 2026
IMPROVED STUDIO PQL editor added to select Knowledge Model entities
You can now use the PQL editor when creating and editing the following PQL-based Knowledge entities: Auto-generated attributes, calculated attributes, filters, and KPIs.
These improvements make working with PQL queries faster, clearer, and more powerful across the platform. They also bring the following benefits:
Pre-save validation: Calculated attributes are now validated before saving.
Improved readability: Display data appears in the sidebar for quick reference.
Enhanced variables: Easily access and apply enhanced variables during PQL query editing.
Flexible entity creation: No more single-column restrictions when creating new entities.
To learn more about creating Knowledge Models, see Knowledge Models.
And for an overview of the PQL editor, see PQL editor.
IMPROVED STUDIO New Data Label settings panel for charts in Views
We've added a dedicated Data Labels panel that gives you flexible and granular control of data labels in charts. It also provides feature parity with the data label customization options available in Studio Analysis (maintenance mode only).
Previously, data labels could make charts in Views look cluttered and the data labels themselves could be difficult to read. With the flexibility and greater control introduced with the new Data Labels panel, you can now:
Quickly toggle data labels on and off.
Move and rotate data labels to improve their readability.
Change the color of data labels, the color contrast and the text size.
Change the offset of data labels to prevent overlap.
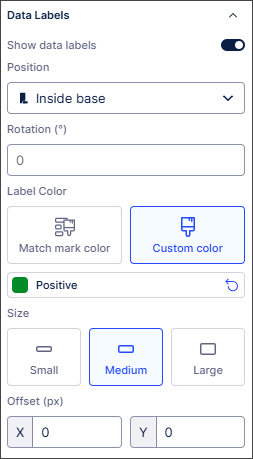 |
For detailed information about the settings available, see Chart data labels.
January 12, 2026
IMPROVED STUDIO Fetch current user information with smart inputs
We've added a new smart input command. This lets you fetch information about the current user like their name, email address and role.
For more information, see Fetching current user information with smart inputs.
PRIVATE STUDIO Analysis to View migration extended to bookmarked filters
With this Private Preview release, you can now migrate bookmarked filters from Analyses to Views.
Previously, bookmarked filters used in Analyses had to be manually recreated from scratch in Views, resulting in additional work for users.
Admin and analyst users with edit permissions can now migrate bookmarked filters as required during the Analysis to View migration and select whether to migrate all bookmarked filters or shared bookmarked filters only.
Once migrated, the bookmarked filter type and owner are respected in the View and shared with the same users in the View as in the original Analysis.
For more information, see Migrating bookmarked filters to Views.
And for more information about our private preview releases, see Feature release types.
IMPROVED DATA INTEGRATION Extractor Builder now supports multiple dependency columns
You can now define multiple dependency columns within Extractor Builder custom configurations, which enables more sophisticated data extractions from your source systems. By setting multiple columns in your dependency configuration, the Extractor Builder automatically generates placeholders for each that you can use in your endpoint configuration to reference its value. This allows you to inject multiple values into a single request for precise data retrieval tailored to more complex use cases.
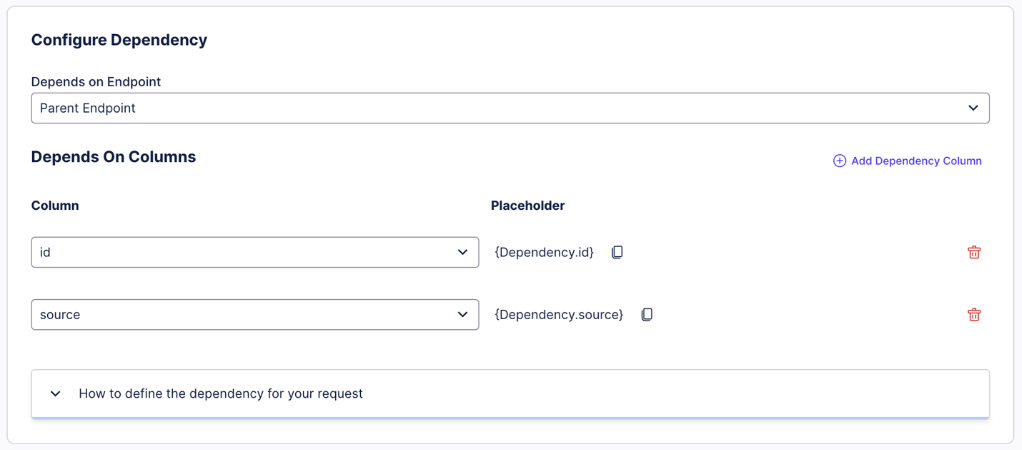
Additionally, this enhancement provides the architectural flexibility required from advanced source systems and APIs that require multi-layered requests. By being able to handle multiple dependency values, platforms that require composite keys or multiple filtering parameters to access data can also now be supported. This helps ensure a more robust and scalable integration process that keeps pace with your data landscape.
For more information on custom Extractor Building configurations, see Extractor Builder.
January 9, 2026
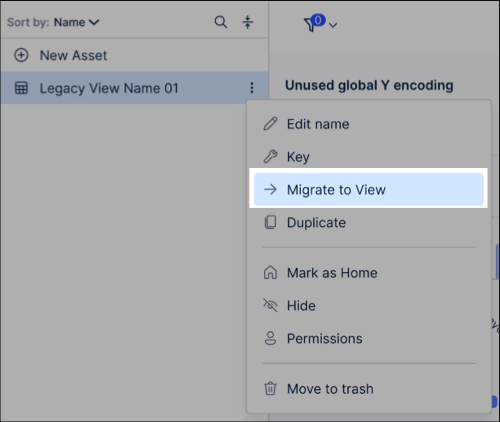
IMPROVED STUDIO Migrate legacy Views using the migration wizard
You can now migrate your legacy Views using the new migration wizard. In addition to migrating individual View components, you can choose between a fast-track migration or a custom migration:
Default / Fast track migration: Automatically migrates your Legacy View and supported features using default settings.
Custom / Step-by-step migration: Lets you choose which connected views, components, and variables to migrate.
Legacy Views are views created using the pre–May 2024 Studio feature set (previously known as the general availability feature set). While you can still use Legacy Views in Studio, they're no longer being developed or enhanced. We therefore recommend migrating your Legacy Views to the current Views feature to take advantage of the latest updates and improvements.
To learn how to migrate your legacy Views to Views, see Migrating Legacy Views to Views.
January 8, 2026
IMPROVED MACHINE LEARNING PyCelonis MLWB Read/Write Access to Augmented Attributes
PyCelonis has been updated to allow Machine Learning Workbench (MLWB) scripts to directly read from and write data to augmented attributes. Previously, interacting with augmented attributes required complex workarounds or was not supported directly. Changes made to data via ML/AI models are now directly and immediately reflected in frontend applications built in Celonis Studio and Views.
Data Scientists and Analysts can now build ML pipelines that directly drive operational applications. Instead of just analyzing data, their scripts can write predictions or classifications back to the data model that instantly update the Studio/Views interfaces used by business stakeholders.
Users must update their PyCelonis package to the latest version to access this capability. For more information, refer to the documentation: PyCelonis - PyCelonis.
IMPROVED STUDIO View filter enhancements
We've made some changes to filters in Studio Views to help simplify and enhance their use.
Built-in (attribute and process) filters are now available in edit mode in addition to view and interactive modes. This lets you create and apply complex filters without writing PQL statements or switching between Studio modes. For more information, see Filtering Studio Views.
You can also now view the underlying PQL statements used to implement View filters in Edit mode. Copying and editing these PQL statements means you don't need to create your own filters from scratch. You can also save your filters to the Knowledge Model as global filters. To find out more, see Viewing and reusing filter PQL statements.
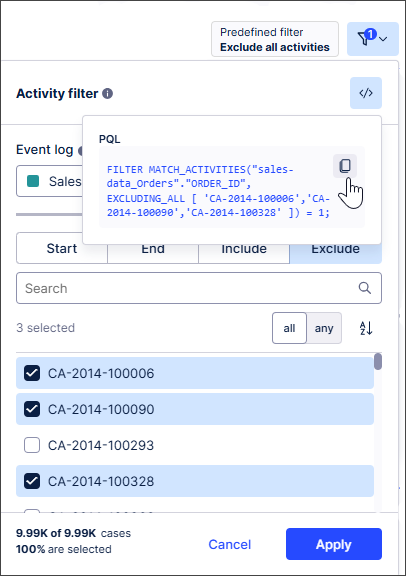 |
We've also made attribute filters more user friendly. You can select which attributes can be selected by business users, helping ensure only relevant options and data are displayed. For more information, see Attribute filters.
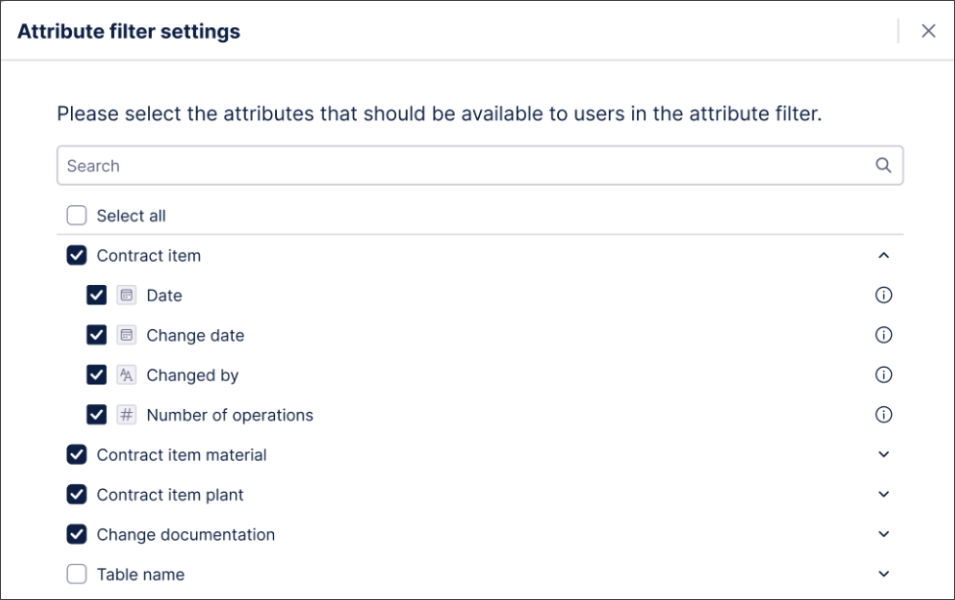 |
We've also improved syncing between process filters and View components. You'll get a notification if an event log is:
Automatically selected in the process filter settings when a View component is configured with an event log.
Removed from a View component.
You can then review and edit your process filter settings if required. For more information, see Process filters.
We've also aligned container components with other components so they can be now excluded from filtering. For more information, see Containers / Conditional layouts.