December 2025 Release Notes
December 19, 2025
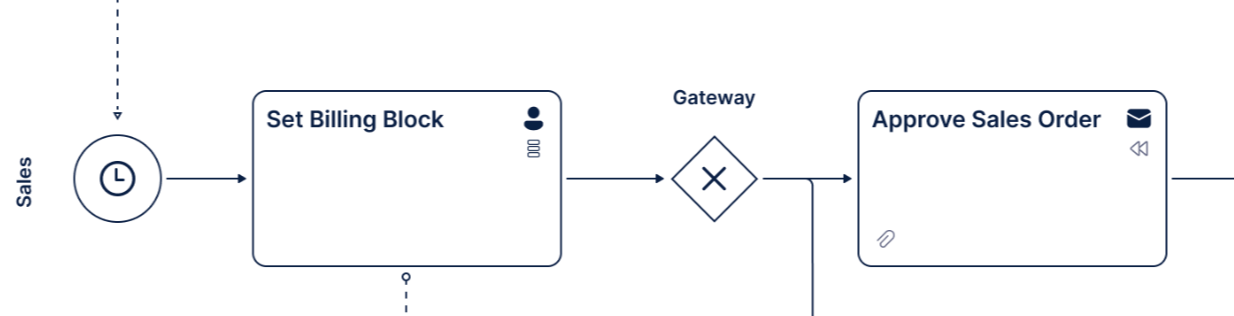
IMPROVED PROCESS DESIGNERPROCESS NAVIGATOR Canvas app updates
We're continuing to add more functionalities to the Canvas app. This update includes:
Improved contrast: We've made the UI easier to read thanks to increased contrast between elements.
 |
Accurate SVG export: The missing message flow issue in SVG exports has been resolved.
Process rendering fixed: The fundamental validation error that was preventing processes from being rendered has been fixed.
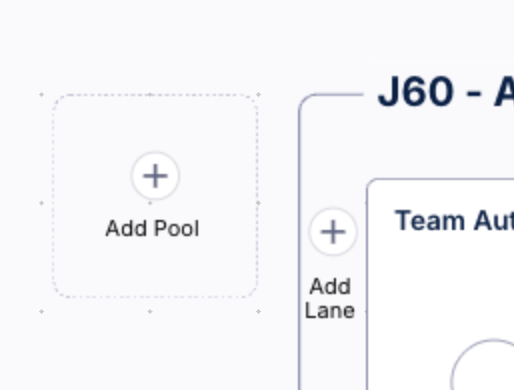
Removed unnecessary labels: The UI no longer shows labels for “Add pool/lane”. The buttons, however, remain unchanged.
 |
Hover on labels: A full label is now displayed when hovering over text that is truncated.
December 17, 2025
NEW TASK MINING Task Mining Client software version 2.20.1
We've released a new version of the Task Mining Client software. This version includes fixes for:
An issue that caused an excessive number of configuration requests.
An issue where URL-based exclusion rules were not correctly applied if the captured URL was missing in the schema.
An issue where invalid Unicode strings could cause event processing to fail.
For more information and a complete list of fixes included in this release, see the Task Mining install file release notes.
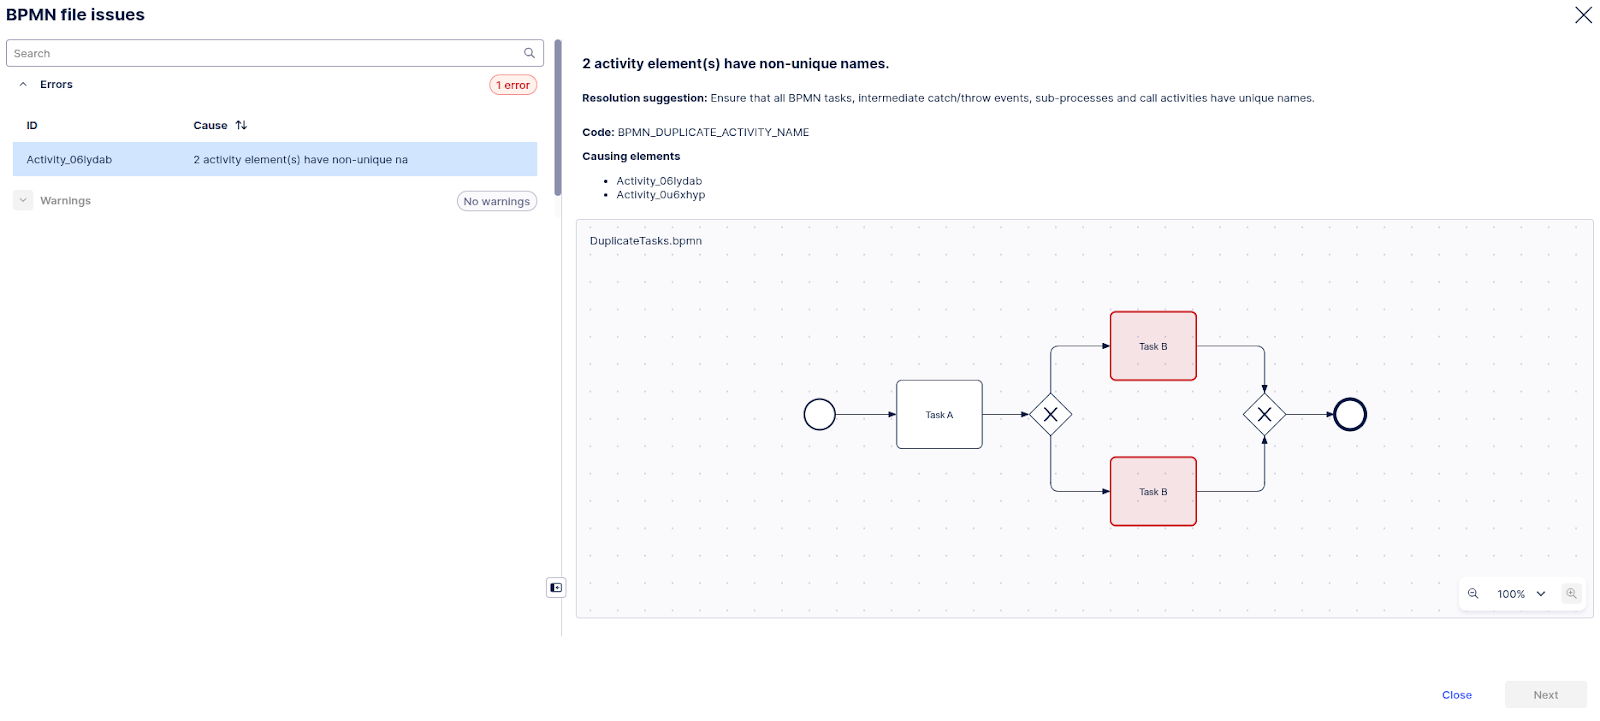
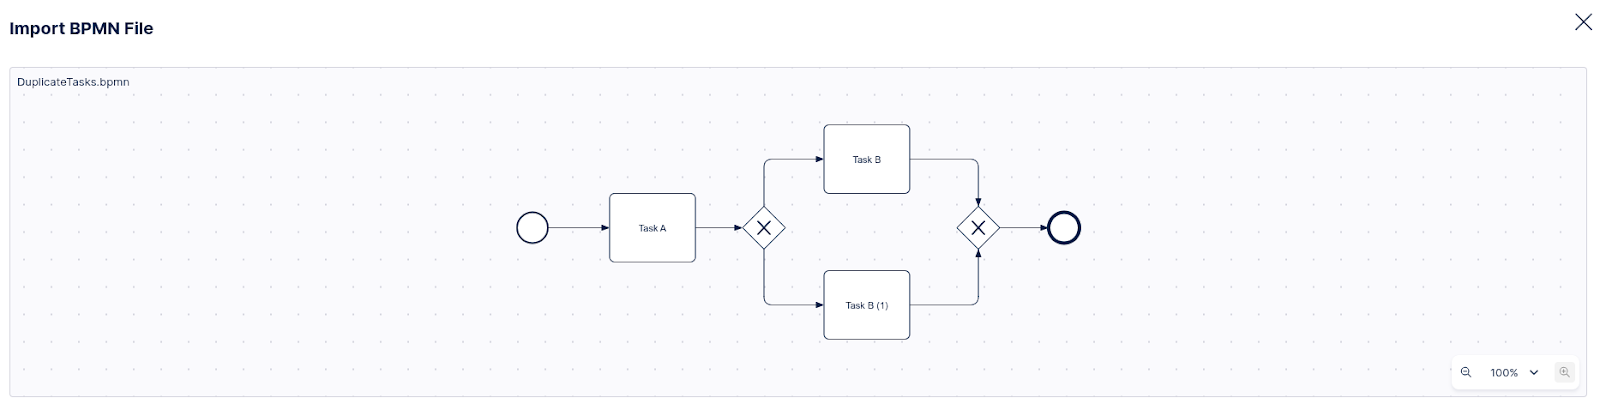
IMPROVED PROCESS ADHERENCE MANAGER BPMN model repair
When importing a BPMN model into Process Adherence Manager, PAM now detects common mistakes within the model (missing start/end events, duplicate or missing task/event names, missing <incoming>/<outgoing> tags) and automatically "repairs" the model to continue the import.
In this example, the imported model had two events with the same name (Task B). PAM detected this, and solved the problem by assigning a suffix that turned them into unique names.
 |
 |
For more information, see BPMN Importer Configuration.
IMPROVED STUDIO OBJECTS AND EVENTS Versioning and deploying packages to replace publishing workflow
We’ve replaced and upgraded the publishing workflow in Studio and Objects and Events with a new versioning and deployment system, giving you greater control over your content. Initially released in public preview, these features allow you to create and manage package and data models versions, track changes, deploy to development and production environments, and efficiently roll back to previous releases.
Studio: Studio lets you deploy packages and control which versions of packages and assets App end-users can access. With version control and support for multiple package versions, you can test new features and configurations before roll out, and offer different App versions for specific use cases via duplicating the package (e.g., locations, products, or teams).
To learn more, see: Versioning and deploying packages.
Objects and Events: Use versioning and deployment capabilities to create, test, and release numbered versions of your object-centric data models. You can deploy to development or production data pools and review or reload earlier versions at any time.
To learn more, see: Versioning and deploying OCDM.
For a video overview of these features:
December 16, 2025
PRIVATE PREVIEW DATA INTEGRATION Delta Sharing connections
You can now use native Delta Sharing connections to transfer data to the Celonis Platform, enabling true zero-copy data integration from your data platforms, such as Databricks and Jira. By leveraging the open Delta Sharing protocol, you can access your raw data directly at the source with near-zero latency, ensuring immediate data freshness in your Celonis data pools.
Delta Sharing simplifies your data pipelines by eliminating complex extraction steps and the duplication of data, allowing you to connect once and begin consuming data immediately. Additionally, since your raw data remains secured in its original location, it preserves your organization’s data governance.
For a video overview of using Delta Sharing:
For more details, see Delta Sharing.
NEW ADMIN New AI models available in AI Settings
The AI Settings in the Admin module are being upgraded with new and more powerful language models. Administrators can now enable the GPT-5 and, GPT-5 mini models for use with their team’s Celonis AI products. Once enabled by the admin, users can leverage the increased intelligence of these new models for use within their AI-enabled Celonis applications.
For more information, see: AI Settings.
December 15, 2025
PRIVATE PREVIEW STUDIO New KPI visualization component in Views
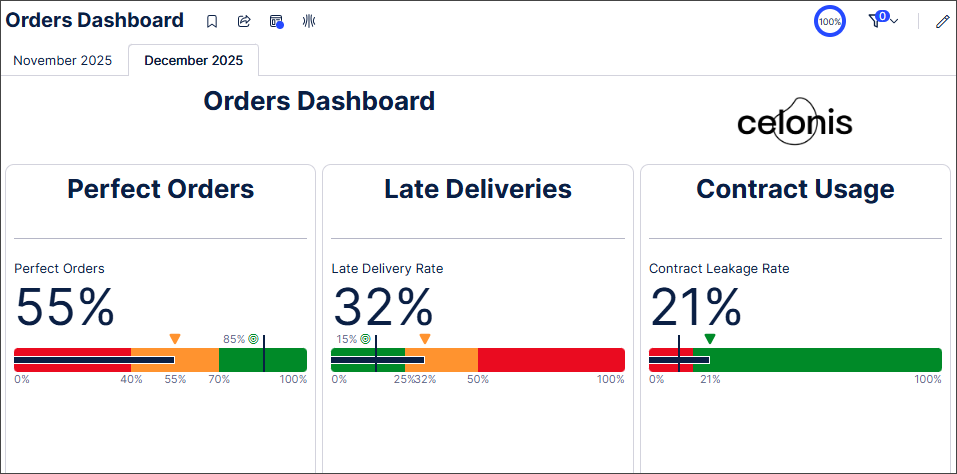
With this private preview release, we've added a new View component called KPI meter.
The KPI meter component displays the current value of a metric on a bullet chart, with color coding indicating different KPI thresholds. You can customize the threshold values and colors used in the bullet chart.
In this example, a dashboard contains KPI meter components that display KPIs related to orders. The color customizations of the different thresholds give a clear visual indicator of how the actual KPI data compares to the defined threshold values.
 |
In addition, the KPI meter component supports the migration of Analyses that use these Single KPI components:
Fill.
Radial.
Gauge.
For more information, see Configuring the KPI meter component.
And to read more about our private and public preview releases, see Feature release types.
December 10, 2025
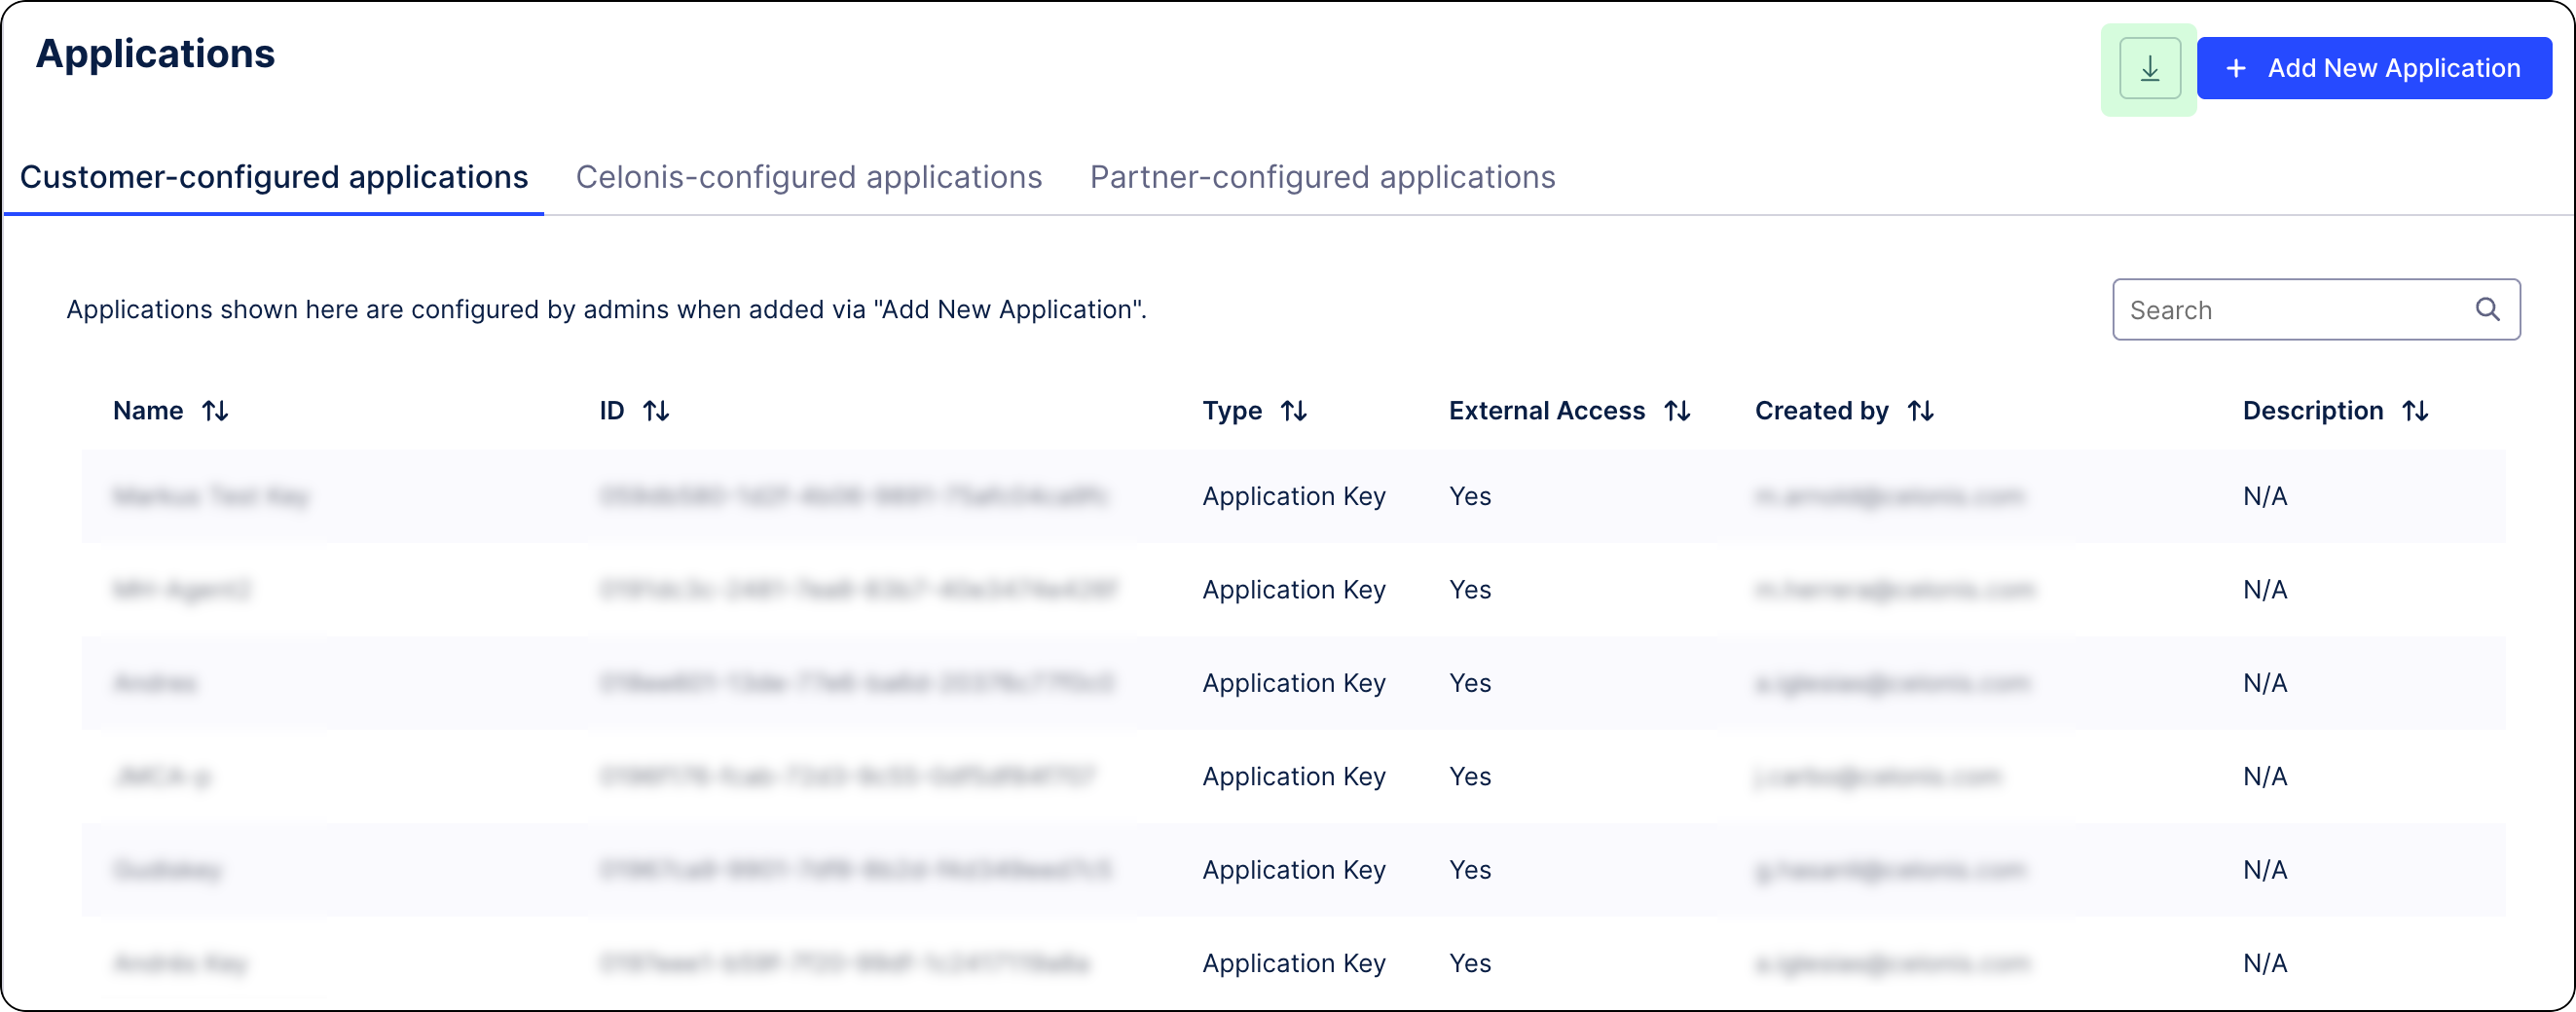
NEW ADMIN Application keys report
You can now download a report of all application keys and OAuth clients used in your Celonis Platform teams. The report provides a comprehensive overview of your applications and includes information on how many application keys exist in a given team, who and when each key was created, and what permissions are associated with them.
For more, see Downloading application key report.
 |
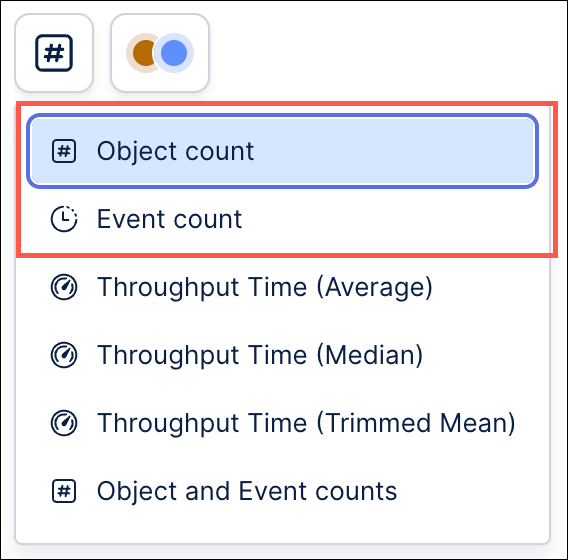
IMPROVED STUDIO New KPI views in Process Explorer and Variant Explorer
The list of available KPI views in multi-object Process Explorer and Variant Explorer configured on object-centric data will now include two new out-of-the-box options: Object count and Event count. These new KPI views are similar to the existing "Object and Event counts" KPI view, but will allow you to focus the metrics displayed in your process graph view on the specific object or event type.
 |
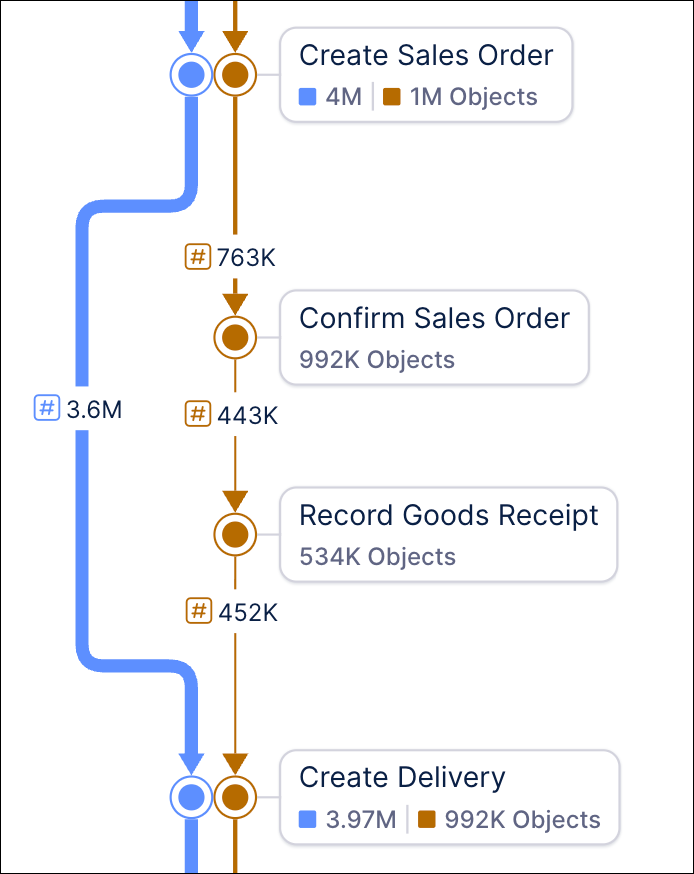
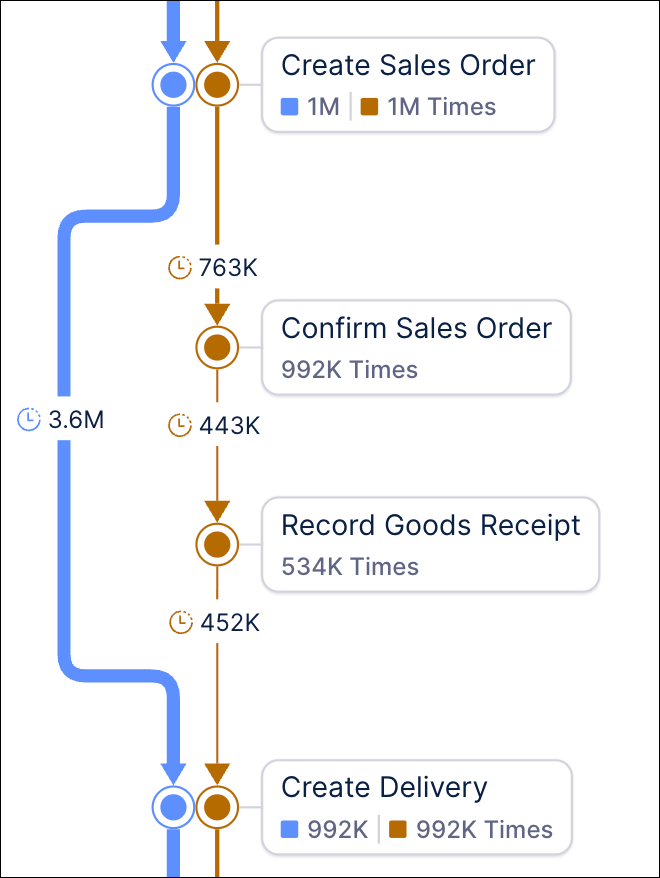
When using the new Object count KPI view, you will see the object count on the connection (the total number of objects that flow through a connection) as well as the event node (i.e. the total number of objects per object type, for which the event has occurred one or more times) of your process graph.
 |
In the new Event count KPI view, your process graph will display the total number of times that connection occurs across all objects of that object type on the connection and the total number of times that event occurs for each object type on the event node.
 |
The existing Object and Event Count KPI view displays object counts on the connections (i.e., the total number of objects that flow through a connection) and event counts on the event nodes (i.e., the total number of times an event occurs for each object type). The Object and Event Counts KPI view will still be available from the KPI view dropdown.
December 9, 2025
IMPROVED STUDIO Asset-to-asset dependency enhancements
You now have greater visibility and control over your asset-to-asset dependencies within Studio, reducing the possibility of broken content and dashboard errors. Studio packages often include multiple assets that are connected and rely on each other. Because of these dependencies, action made to one asset, such as publishing, copying, or deleting it, can have a direct impact on other assets that reference it. For instance, deleting a Knowledge Model could break the Views that rely on it.
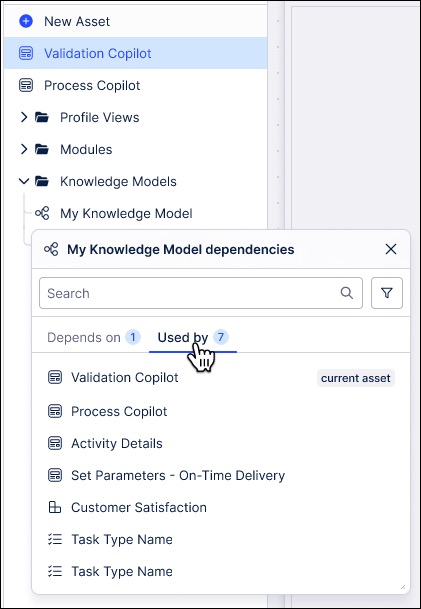
To help you manage these relationships, Studio now offers features that allow you to:
View dependencies between assets so you can see which items are linked.
Highlight potential impacts before you make changes, reducing the risk of unintended errors.
Maintain a clear view of your package structure.
Note: Dependencies coming FROM an Action Flow are not visible yet. However, dependencies TO an Action Flow can be seen.
To learn more, see: Asset-to-asset dependencies.
December 5, 2025
IMPROVED STUDIO Opening a linked View as an overlay or side panel
We've made usability improvements to our linked Views feature, making them easier to configure from table and button components. You can now create and configure a linked View from within your existing View, whereas previously your target View could only be an existing View within the same Studio package.
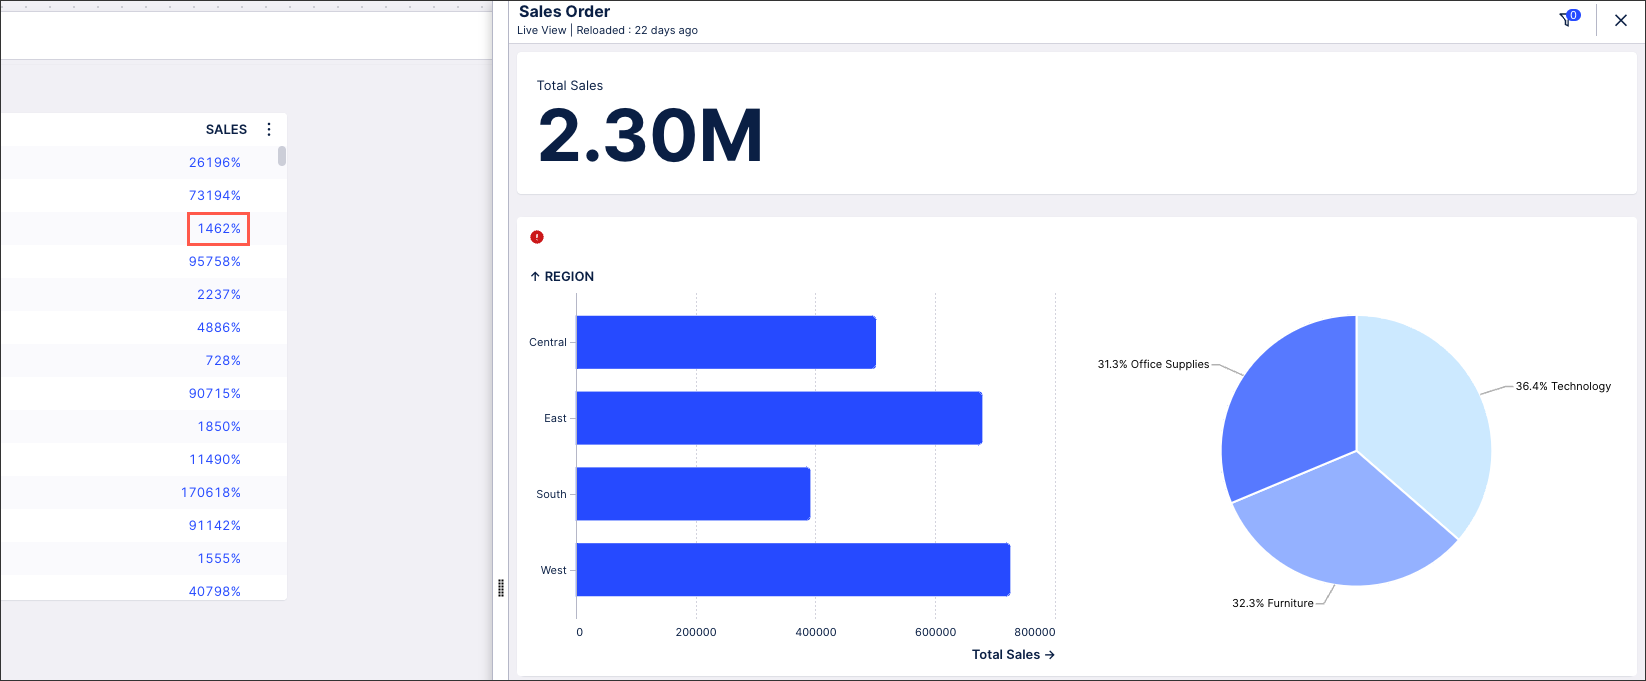
In this example, when clicking data in the SALES column the app will display the 'Sales Order' target View as a side panel. There is also an active mapping for the View variable "SalesOrder" from the target View. This variable will get updated with the "Order_ID" of the row in which the click in the table is done.
 |
To learn how to configure linked Views, see: Linked Views.
PRIVATE PREVIEW PRODUCT mTLS authentication method now supported
With this private preview release, you can now configure an mTLS authentication method when connecting to your source system using a custom REST API extractor.
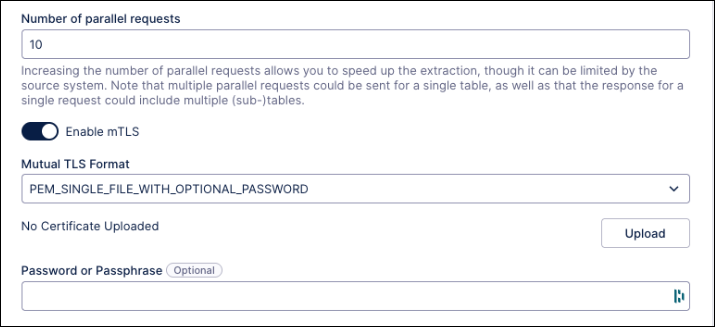
To configure mTLS authentication, you need to choose one of the supported mTLS formats:
Single PEM file (with optional password)
Multiple PEM files (with optional password)
PFX or P12 (with password)
Dependent of the chosen format, you need to provide the required certificates and/or passwords:
For single PEM file, one file needs to contain the inputs in the following order: Client Certificate, Client Key, CA Certificate.
For multiple PEM files, each files are uploaded separately.
For more information about authentication methods, see: Extractor Builder authentication methods.
And to learn more about our private preview releases, see: Feature release types.
FIXED PROCESS DESIGNER Intranet links and other performance fixes
We've added the ability to allowlist a domain. We originally prevented this due to security reasons, but we noticed that it resulted in customers having problems with adding intranet links.
To add an allow list, go to Admin section > Process Designer settings > Filter by “Link positive list” and add your configuration.
Other bugfixes in this release include:
Improved performance when adding a role through the detailed content and importing Symx files.
Manuals can be regenerated again.
List views are able to be sorted again.
Fixed an issue that caused image symbols and link objects in the graphic editor to vanish during save.
Fixed an issue that caused data objects to be lost when importing a BPMN file.
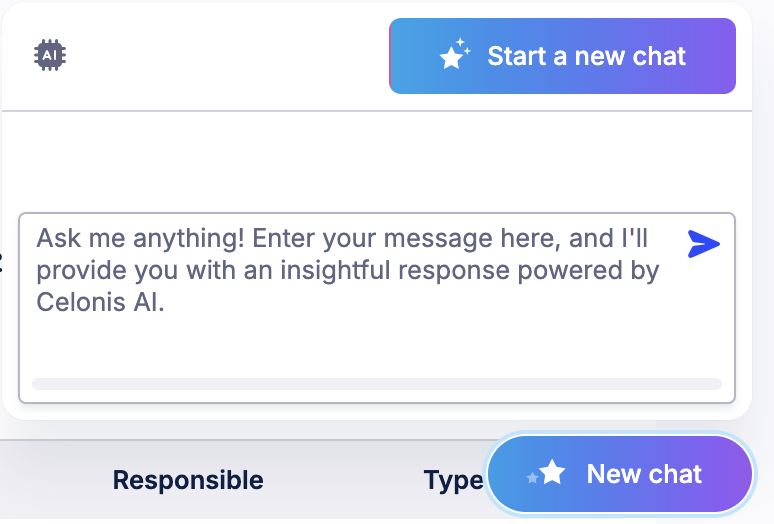
REMOVED IMPROVED PROCESS NAVIGATOR AI chat decommissioned, new slider widget, UI changes
AI chat removed
We have removed the AI chat. It was a Beta feature which did not perform as we expected and does not align with Celonis's overall AI development strategy. We'll work on another version of AI assistance in the future.
 |
Slider widget improvements
The old slider widget was difficult to navigate, owing to the fact it took up a large portion of the screen. We've updated it so that the widget is now narrower. This allows for the most important links to be displayed right at the top.
Other improvements to the slider widget include:
Improved link display and slideshow control, to reduce space and provide more intuitive interaction
Links are no longer required on a slide
Changed layout of text and picture, so that text is shown on a clean background while the supporting picture will be to the right of the text
Pictures are no longer required on a slide
These changes do not affect configuration method, and are compatible with existing configurations. No migration or changes are expected. Some minor impacts could include:
If no link was included in a slide, the slideshow would have shown a button regardless, but the new slideshow will not show a link.
Image dimension would be slightly changed, and the size of the image would be reduced. Admins can simply make modification if needed as before.
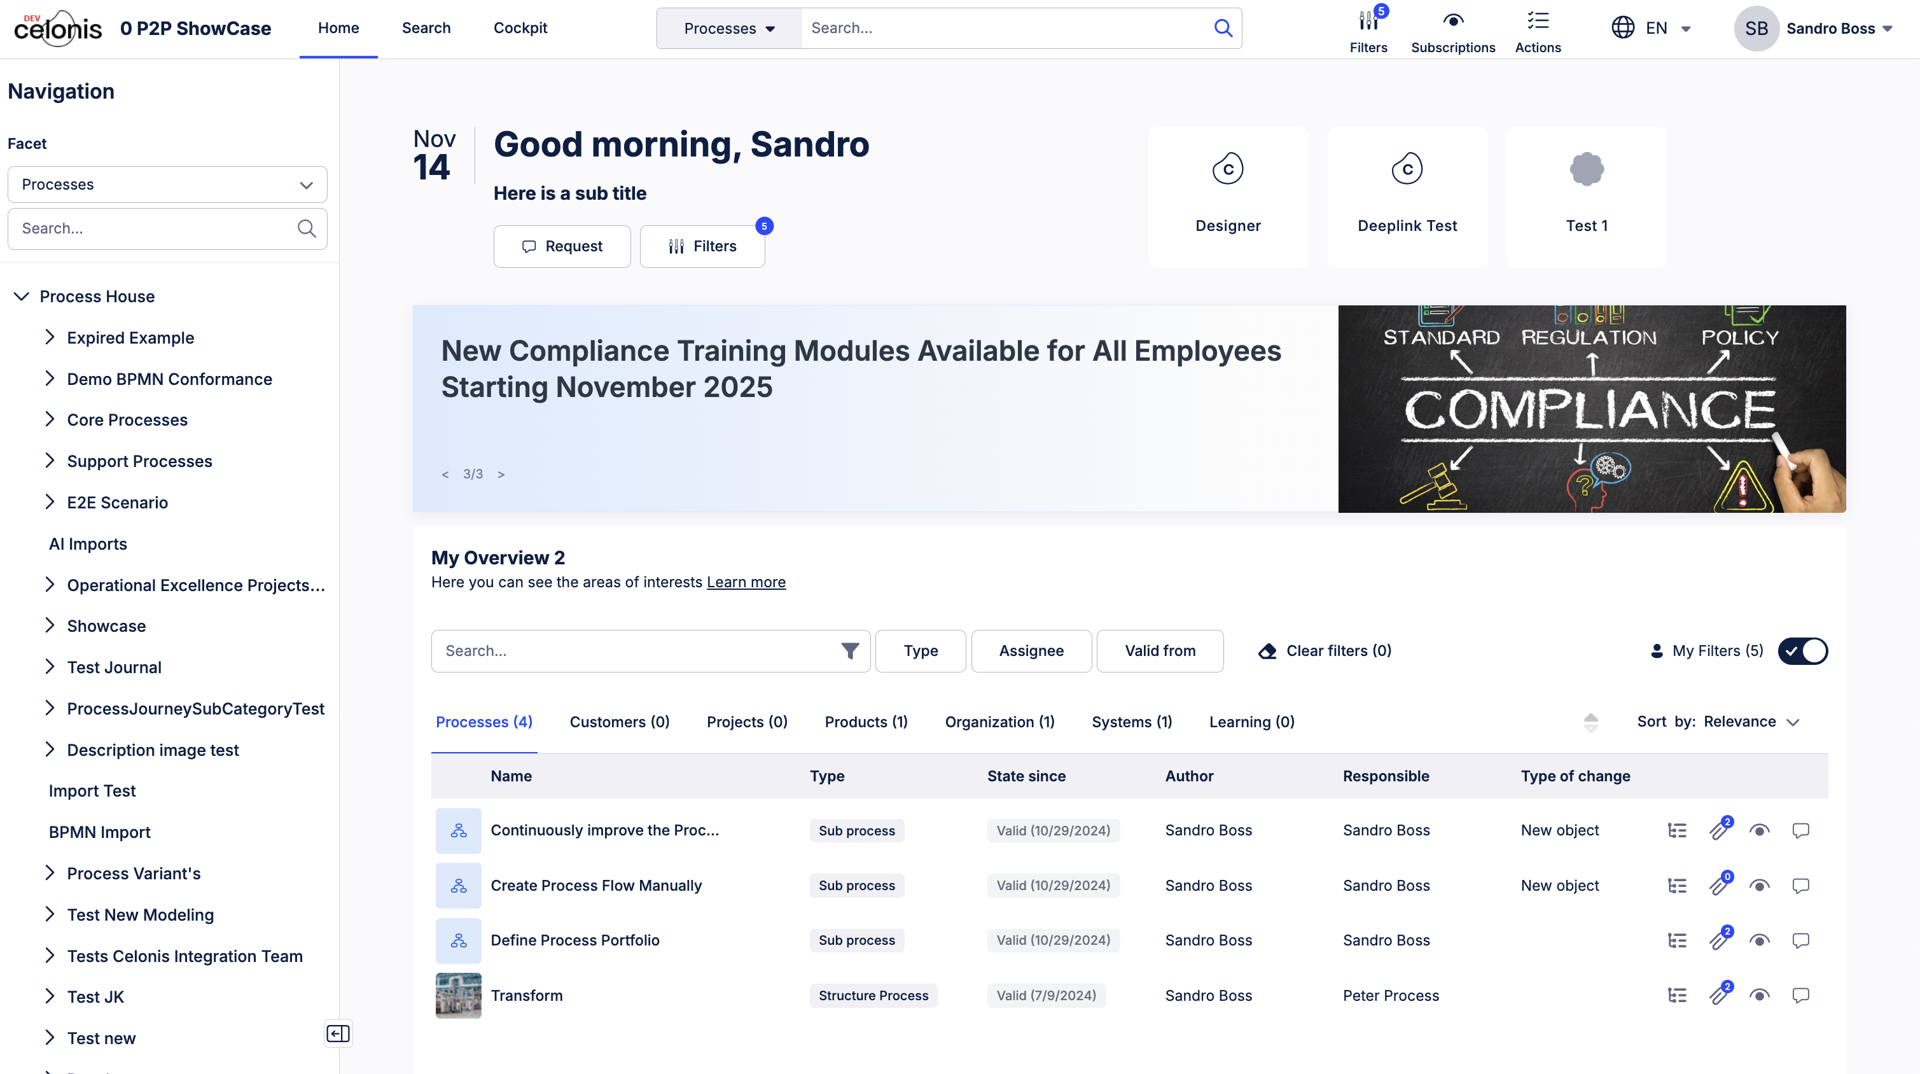 |
UI changes
We made the Hierarchy Navigation more prominent so the panel is expanded by default, and the collapse bar is more visible.
We've reduced number of clicks needed when looking for processes by making the global search based on the Process facet by default. You can still search across all facets, or another specific facet by filtering on the drop down left to the search bar.
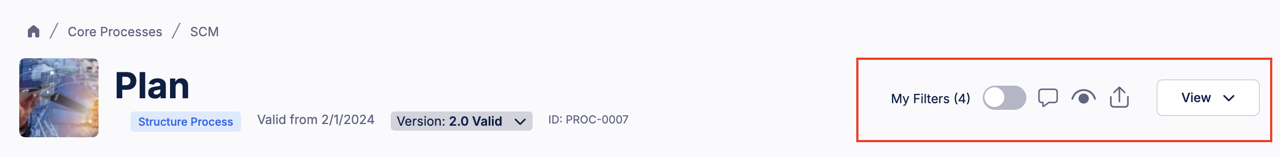
We've improved the Homepage UI by making the quick access buttons right-aligned. We also updated the "My Overview” widget, with “View Hierarchy” in a more prominent location so that users can more easily see where each object belongs in the hierarchy.
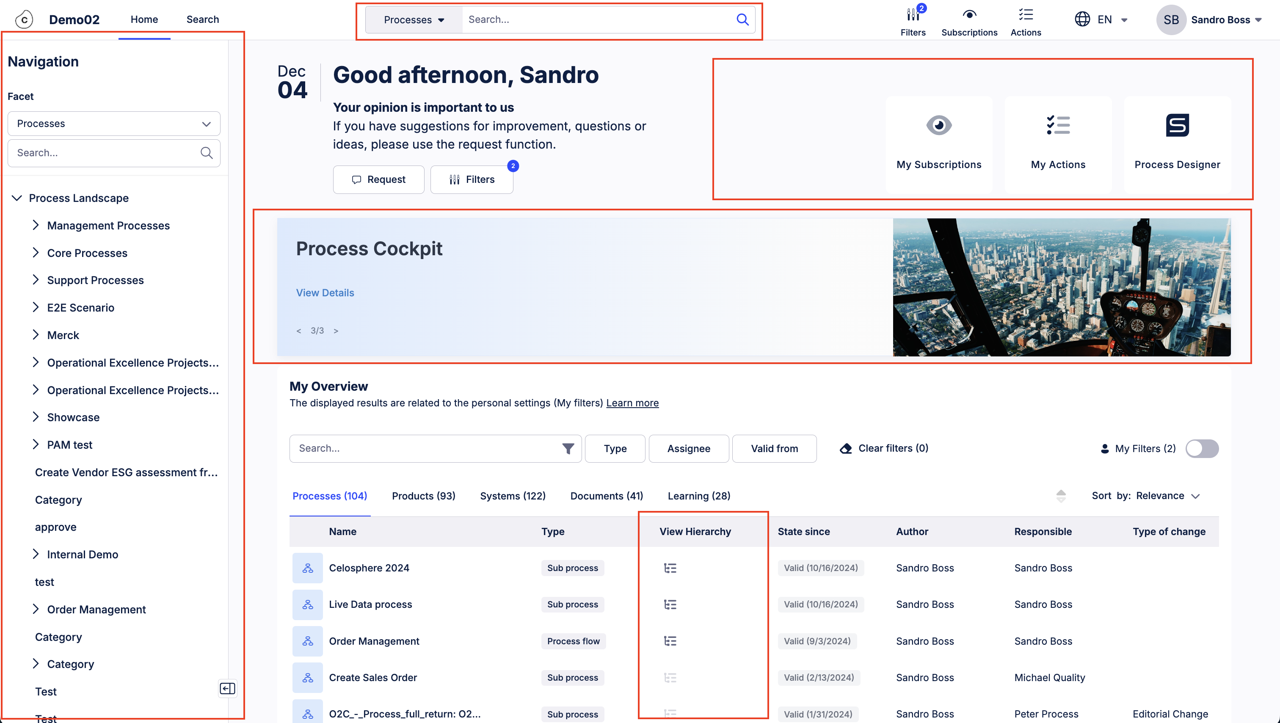
We've resized the Action button on Journal Pages to be more readable and accessible.
We now truncate the name field when the name of a subscription is too long for the space, instead of pushing out past the edge of the screen.
Lastly, we made some small but impactful updates to the Action Center. They are as follows:
Removed redundant list button
Updated tab name to say "CPM Action Center"
For more information, see the Process Navigator User Guide.
December 4, 2025
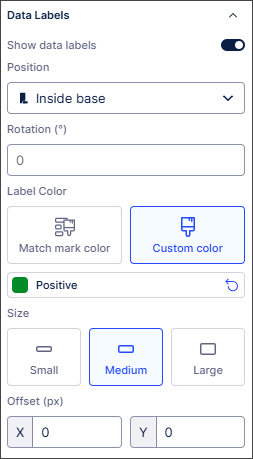
PRIVATE PREVIEW STUDIO New Data Label settings panel for charts in Views
With this private preview release, we've added a dedicated Data Labels panel that gives you flexible and granular control of data labels in charts. It also provides feature parity with the data label customization options available in Studio Analysis (maintenance mode only).
Previously, data labels could make charts in Views look cluttered and the data labels themselves could be difficult to read. With the flexibility and greater control introduced with the new Data Labels panel, you can now:
Quickly toggle data labels on and off.
Move and rotate data labels to improve their readability.
Change the color of data labels, the color contrast and the text size.
Change the offset of data labels to prevent overlap.
 |
For detailed information about the settings available, see Chart data labels.
And to read more about our private and public preview releases, see Feature release types.
December 3, 2025
PRIVATE PREVIEW STUDIO Stacking and grouping metrics across dimensions for bar and column charts
With this private preview release, you can now quickly and easily split bar and column charts in Views across dimensions, letting you create stacked or grouped charts that adapt seamlessly to your data and provide accurate and meaningful data visualization.
Previously, creating stacked/grouped bar and column charts involved stacking/grouping multiple metrics and manually defining each stack or group in the bar or column chart individually. This required significant effort for larger data sets and was impractical when dealing with dynamic data as multiple metrics needed to be added and maintained.
Now you can select which metrics are used to stack or group your data, set the ordering to ascending or descending and define how many stacks or groups are displayed (maximum of five). You can also choose the display colors for the different dimensions within each stack or group.
In this example, the bar chart displays multiple product sub-categories, with the stack length indicating the total sales for each product sub-category. Setting the Split by option to Ship Mode displays the number of items shipped by each shipping method for each product sub-category, as well as the average sales for each shipping method. Changing the colors used to display the different shipping methods aids visualization.
For more information, see Data dimensions and metrics.
And to learn more about our private and public preview releases, see Feature release types.