Vega component charts
This feature is currently available as a Public Preview only
During a Public Preview, only eligible customers can access this feature. Additionally, there may be minor updates to the functionality and design of these features when they are released in General Availability.
For more information about our Public Preview releases, including the level of Support offered with them, see: Feature release types.
The Vega component is a custom code component used to create advanced custom charts. With the Vega component, you can create highly-customized, niche visualizations that use Vega and Vega-Lite directly within the Celonis Platform, giving you flexibility and extensibility. You can also leverage chart samples from the Vega-lite example gallery and adapt them for for your specific use case.
Important
We strongly recommend using the Vega component only where other chart components are not sufficient for your visualization.
Access the JSON specification for a chart that is similar to the chart you want to create.
Tip
You may, for example, use an AI tool to help generate the JSON specification. Or the Vega-lite example gallery contains example charts you may find useful.
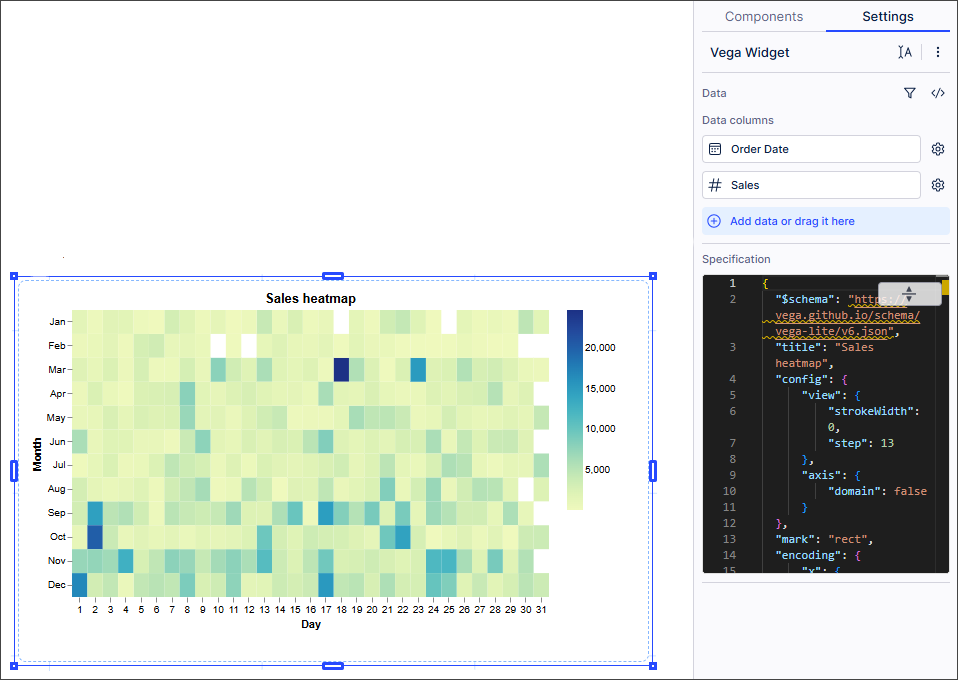
In edit mode, add a Vega Widget component to your View.
Add the data fields you want to include in your chart from the Knowledge sidebar.
Copy the JSON specification for the chart in step 1 and paste it into the Specification code area.
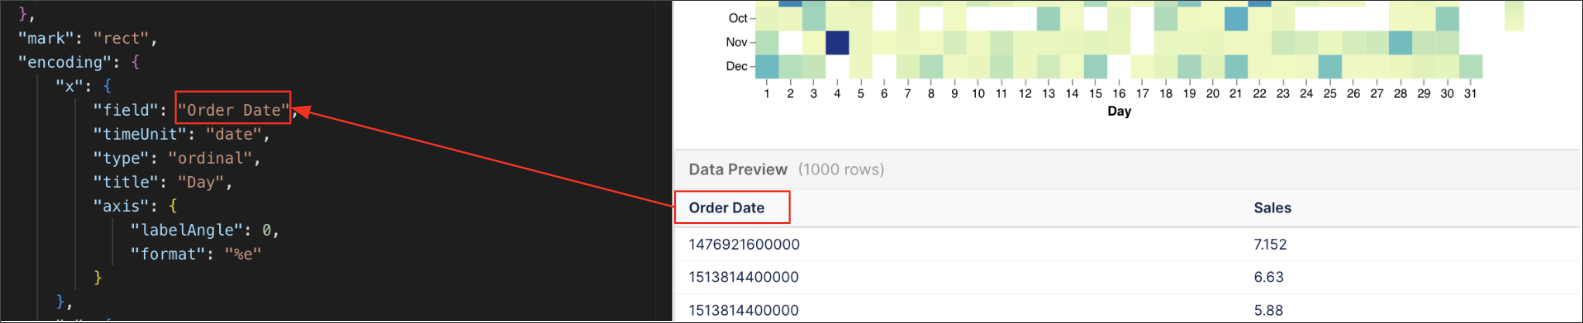
Update the Vega-Lite JSON specification in the Specification code area to ensure it correctly references the field names in your query. This defines how the request maps to the field names in your query.
Important
Reference the field names using the
display Nameas shown in the Data Preview, ensuring case and spacings are respected. As the data defined in the query is automatically available, you don't need to include adatablock like"data": {"url": "data.csv"}or"data": {"values": [...]})in your JSON.Use the Data Preview panel to verify that your Vega-Lite specification correctly maps to the field names in your query.
Vega component limitations
One-way filtering: While all View and Knowledge Model filters are respected, bi-directional filtering where you click the component to filter the rest of the View is not yet supported.
Basic mapping: Advanced tile-based features like zooming and panning are not supported as the component currently uses Vega’s integrated vector maps.
Input variables: Input variables in PQL queries are not currently supported.
Tooltip styling: Custom styling like using specific fonts/colors is not currently supported.