2026 Release Notes
Jun 24, 2026
PRIVATE PREVIEW TASK MINING ETL Engine support added
With this Private Preview release, Task Mining is now compatible with the ETL Engine
Previously, it wasn't possible to fully migrate Task Mining projects to the ETL Engine or create new Task Mining projects using the ETL Data Pool.
With this change, Task Mining projects and data processing are now compatible with the ETL Engine, allowing you to benefit from increased data processing capacity and improved data freshness.
For more information, see the ETL Engine.
June 23, 2026
NEW STUDIO Insight generation for KPI cards and lists within Views
You can now automatically generate Insights for KPI card and list components in Views, allowing you to explore how you can increase or decrease individual KPI values.
Previously, you generated Insights in Insight Explorer before exporting these Insights to Views. With this new functionality, you can now generate Insights directly within Views, making it easier to access the generated Insight data.
You can also see the impact of different attributes on the generated Insight data, before applying the attributes selected as filters to the overall View.
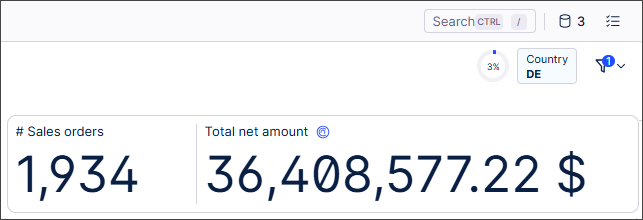
In this example, we're exploring how to increase the total net amount value and viewing the generated Insight data by country:
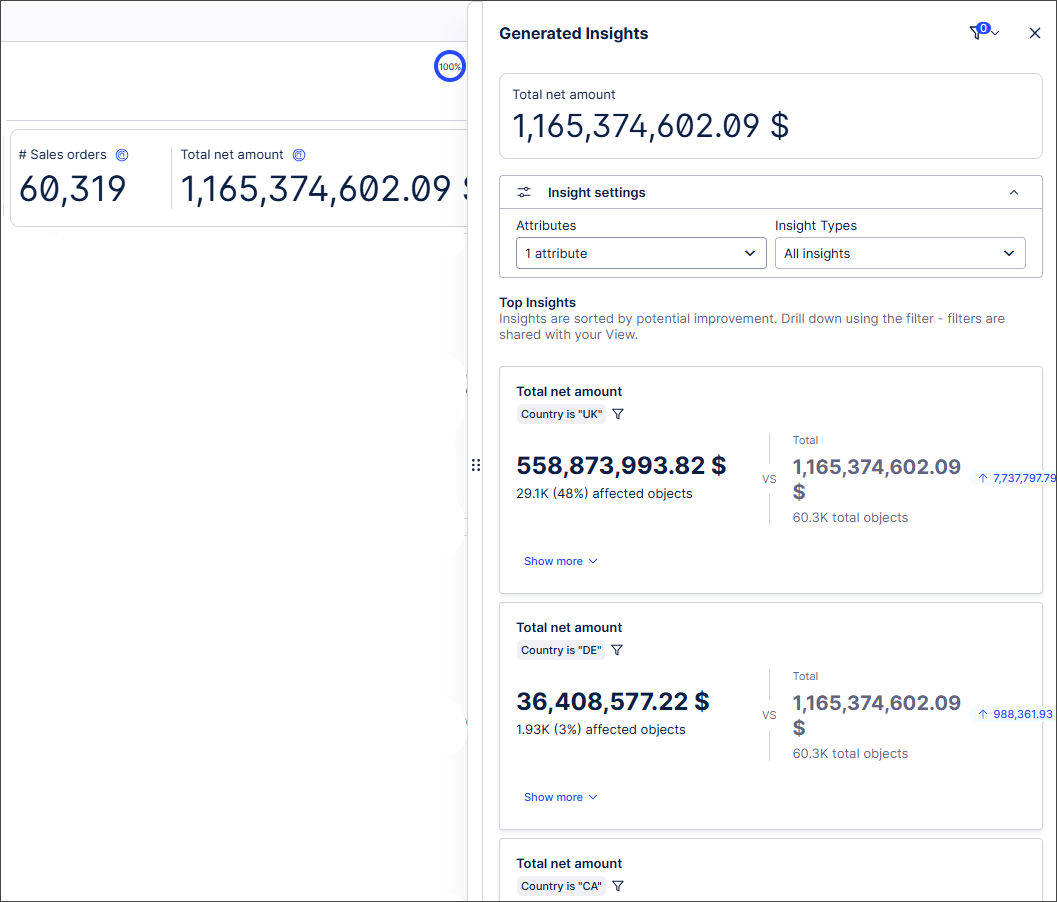 |
We can then apply a country as a filter and drill down further into the filtered data with a new generated Insight:
For more information, see Generating Insights for KPI cards and KPI lists.
June 22, 2026
IMPROVED STUDIO Live reasoning traces for Process Copilots
The new live reasoning traces in Process Copilots will allow you to follow the thinking and decision-making step-by-step as your Process Copilot works through a query. These live reasoning traces show which tools are being called by the Process Copilot, what data is being retrieved, and how it arrives at the final answer provided.
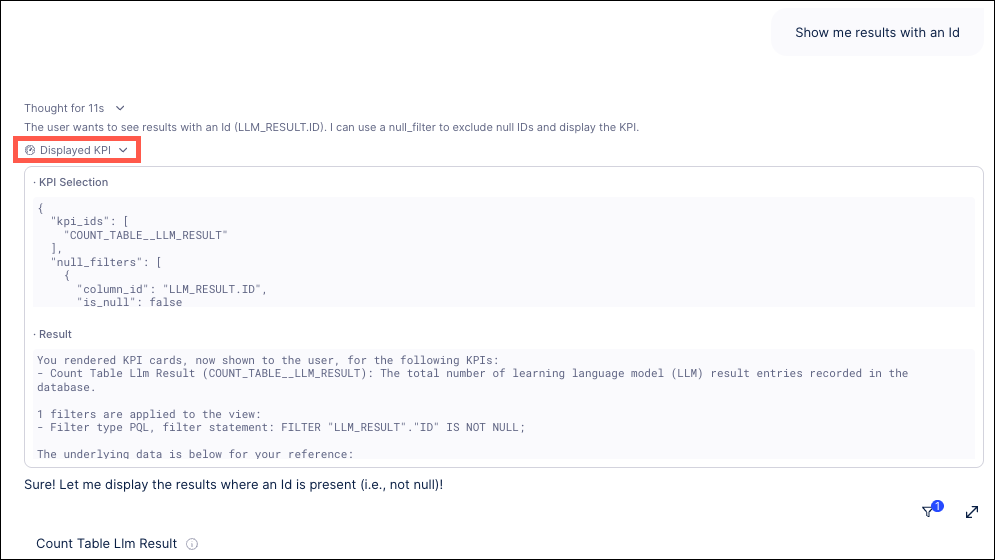 |
To see the live reasoning traces, submit a query to your Process Copilot and then expand the reasoning section within the answer to watch the execution steps, tool calls, and data retrievals unfold. This allows you to analyze the step-by-step logic to ensure the correct data and tools were used to formulate the final response, which provides more confidence in the validity of the response.
For more information, see Process Copilot responses.
June 19, 2026
PUBLIC PREVIEW STUDIO Vega custom chart component added
We've added a new custom code component in Public Preview to give greater flexibility for highly-customized visualizations in Views.
While existing Chart components cover most standard use cases, complex visualization requirements have been less well served.
With this new component, you can now create highly-customized, niche visualizations using Vega and Vega-Lite directly within the Celonis Platform, giving you extra flexibility and extensibility for advanced analytical requirements. Leveraging the Vega-Lite example gallery and adapting the JSON code as necessary helps reduce the amount of coding required.
In this example, we've created a heat map based on an existing Vega-Lite specification, with the JSON code adapted to ensure the Vega-Lite specification maps correctly to the field names:
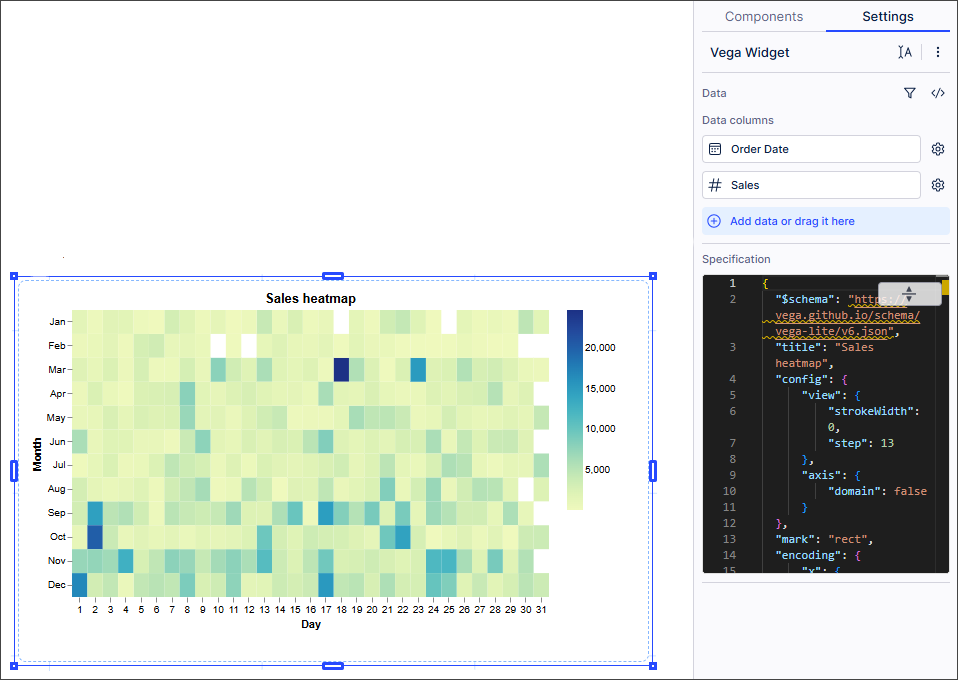 |
For more information, see Advanced custom charts.
And to read more about our public preview releases, see Feature release types.
June 16, 2026
IMPROVED STUDIO Customizing Performance Spectrum patterns
You can now customize Performance Spectrum patterns by adding or removing events and defining how they connect. When configuring your process steps, you can choose between two connection types:
'Followed Anytime': The subsequent event can occur at any point after the preceding event.
'Directly Follows': Events must occur back-to-back, with no other events in between.
The Performance Spectrum component maps your process steps along a visual timeline, showing you exactly how individual cases travel over time. It gives you a clear, real-time look at your workflows so you can spot hidden bottlenecks and patterns at a glance.
To learn more about configuring and using the Performance Spectrum component, see: Performance Spectrum

PRIVATE PREVIEW STUDIO Updated controls for Process Explorer and Variant Explorer
The controls used for the process graphs in Process Explorer and Variant Explorer are being redesigned to provide a more compact experience. These changes do not involve any new functionality or the removal of any existing functions, but will involve features being relocated within the interface. These updates will better align the Process Explorer and Variant Explorer interfaces with the designs used in other Studio components.
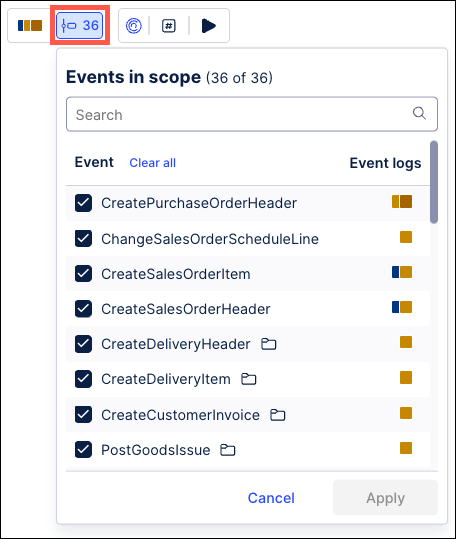
The Events/Activities menu has been given a new icon and moved from its previous location in the upper right corner of the process graph. This function will now be featured next to the Event Log selector in a new tool bar in the upper left. You will still use the Events/Activities menu to select the specific events or activities you want to include or hide in the process graph.
 |
Also in this update, the controls for the Animation settings are being moved from below the process graph to a new toolbar combined with the KPI selector and the Generate Insights icon. This new toolbar will display next to the toolbar containing the event log selector and the Events/Activities menu.
 |
Note
The Animation controls will only display for Process Explorers.
As another part of this change, the Zoom controls at the bottom of the screen are being reconfigured. The Zoom to fit option is being moved from the dropdown list of percentages and added as a separate icon to the left of the Zoom Out icon.
 |
To learn more about our Private Preview releases, see: Feature release types.
June 15, 2026
NEW OBJECTS AND EVENTS Define composite primary keys on object-centric data model attributes
For source systems where uniqueness is defined by multiple attributes, Objects and Events now supports composite primary keys. Composite primary keys allow you to define a primary key using more than one attribute directly in the data model. This removes the need to manually concatenate attributes in transformation logic and helps improve query performance.
Previously, all object and event types in the object-centric data model required a single ID attribute with a String data type. This attribute served as the PK, uniquely identifying each row and enabling joins across objects and events. For source systems with composite PK (multiple columns), users had to manually concatenate these columns into a single ID using SQL transformations.
You can now define the PK for objects and events in one of two ways:
Single ID attribute (legacy approach): Provide your own ID column as the PK, as before.
Composite PK: Select multiple attributes to form a composite PK.
For more information, including a step-by-step guide to defining composite primary keys, see: Composite primary keys.
June 13, 2026
IMPROVED STUDIO Displaying chart values as a percentage of the overall value
You can now display values in your chart as a percentage of the overall value.
Previously, displaying values as a percentage of the overall value involved performing manual calculations and writing complex PQL statements.
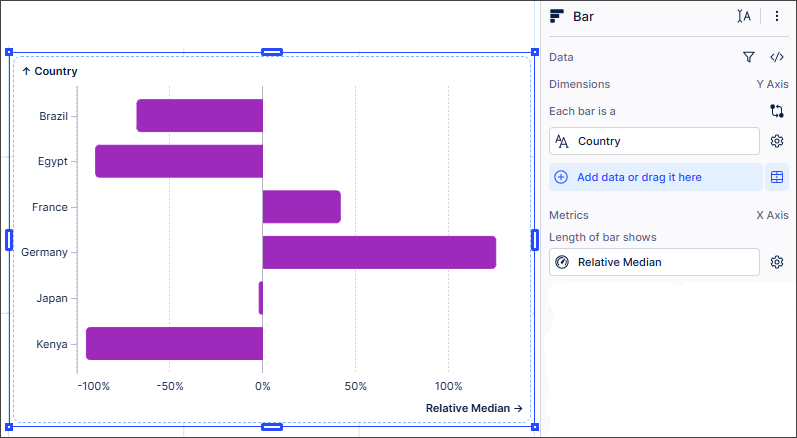
Now, you can drag and drop a metric from the Knowledge sidebar and select whether you want to display data in your chart as a percentage of the overall total value (Relative Sum) or as the percentage difference between each value and the overall value (Relative Average and Relative Median). This is supported for all Category charts; KPIs are not supported.
In this example, the values for each country are displayed as a percentage compared to the overall median value, with some countries (Brazil, Egypt, Japan and Kenya) falling below the overall median value while others (France and Germany) lie above.
For more information, see Displaying chart values as a percentage of the total.
June 12, 2026
PRIVATE PREVIEW STUDIO Package branching added
We’ve added branching for packages in Private Preview.
Previously, only one user at a time could make changes to packages. This resulted in save conflicts if multiple users wanted to make changes to the same package at the same time.
With this new functionality, multiple users can work simultaneously and independently in branches. Once all changes have been made and tested, branches can then be merged back into the main branch.
Admin users can view branching changes in the audit log with the addition of new BRANCH_CREATED, BRANCH_DELETED and BRANCH_MERGED events.
For more information, see Working with branches and to to find out more about audit log events in Studio, see Audit logs - Event details.
To read more about our private preview releases, see Feature release types.
June 10, 2026
PRIVATE PREVIEW DATA INTEGRATION Iceberg REST catalog zero-copy connections
Establish native, zero-copy connectivity between the Celonis Platform and Amazon S3 Iceberg REST Catalog endpoints. With this connection, updates to your Iceberg tables are immediately discoverable and accessible in your data pool without extraction lag or storage duplication.
This connection architecture helps eliminate data pipeline maintenance and storage costs while keeping your data securely within your AWS infrastructure. Additionally, your live data is instantly ready for data transformations and process analysis.
For more information, see Iceberg REST catalog zero-copy.
To learn more about our private preview release, see: Feature release types.
PRIVATE PREVIEW DATA INTEGRATION Establish zero-copy connectivity AWS S3 and Glue Catalogs
Using a zero-copy connection, you can now connect Iceberg-formatted data lakes stored in AWS S3 and cataloged via AWS Glue directly to the Celonis Platform. Once connected, the Celonis Platform queries your data directly at the source, meaning any source updates are automatically reflected in the configured data pool. This eliminates data duplication and manual extraction pipelines while preserving your source data governance.
To ensure secure access, the connection supports AWS IAM role delegation. This authentication method allows you to establish a trust relationship with Celonis using a designated external IAM User ARN and a unique External ID condition, eliminating the need to manage static credentials.
For more information, see Amazon S3.
To learn more about our private preview release, see: Feature release types.
June 8, 2026
IMPROVED STUDIO System Prompt validation in Annotation Builder
The Prompt Assistant in the System Prompt step of the Annotation Builder configuration has been updated to automatically validate your custom prompts prior to execution. With this update, your custom system prompt is now validated against the system schema to identify issues and provide a list of errors to fix prior to creating the prompt. Resolving these issues during the set up process allows you to avoid conflicting instructions that could break your execution pipeline during processing.
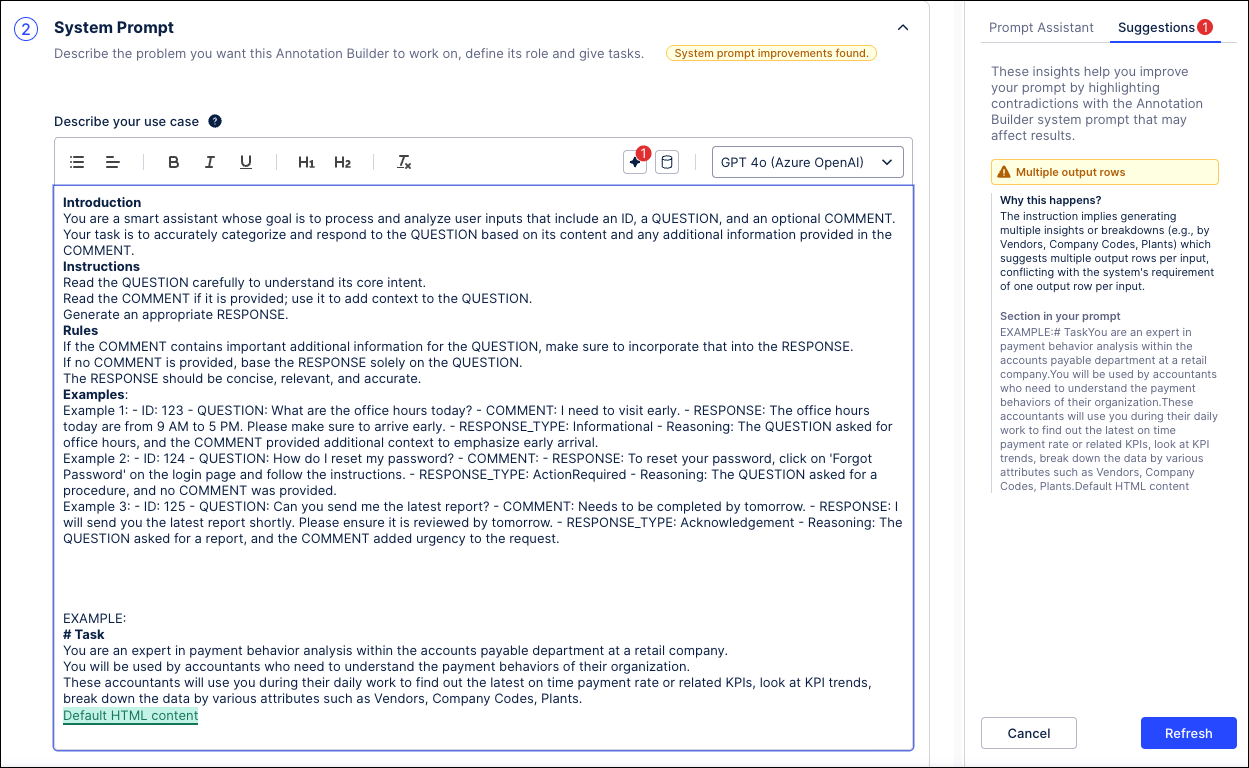
As you create your System Prompt, if the validation identifies any conflicts, the Prompt Assistant icon displays a notification indicating the number of issues detected. Click the Prompt Assistant icon and a side panel is opened containing suggested fixes, including an explanation of the problem and which part of your prompt is causing the issue. These suggestions allow you to resolve these issues before submitting your configuration.
 |
Previously, users could create prompt instructions that directly conflicted with the Annotation Builder's internal execution and post-processing logic. These conflicting instructions led to execution errors and invalid JSON outputs. The most frequent conflicts included instructions asking for variable row outputs in their prompts when Annotation Builder requires 1 output row per 1 input row, trying to specify the file structure in their prompt, and defining output default values or categories when the allowed values and limits are pre-configured in the Annotation Builder output schema.
For more information, see System Prompt.
June 2, 2026
IMPROVED STUDIO Process Explorer enhancements
We’ve made the following usability improvements to the Process Explorer component in Studio:
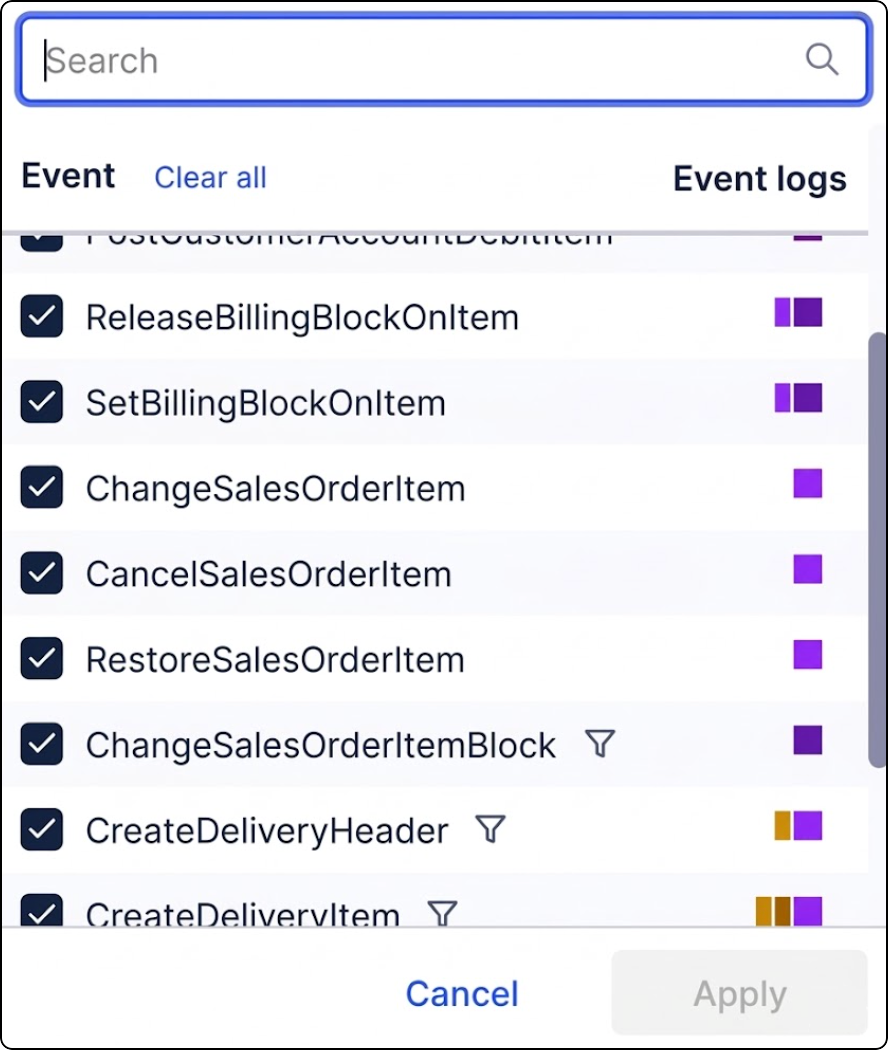
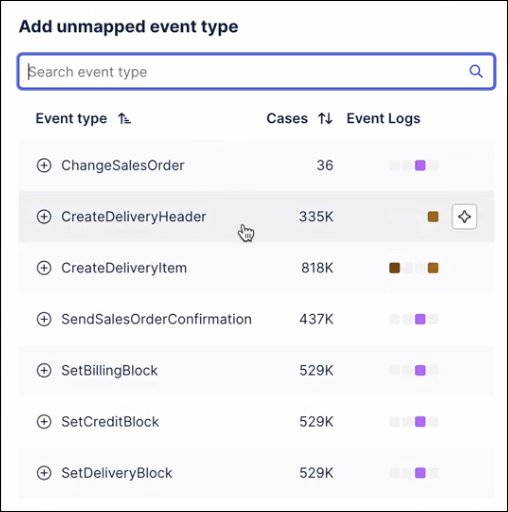
We’ve removed the limitation on how many events are displayed in Process Explorer. The list of events now displays all available events, with the most relevant 5000 events displayed first.
You can use the search bar to find any events in your event logs.
Events on the list that are not visible in the Process Explorer graph are now marked with a filter icon.
For more information, see Show / Hide events in PE.
June 1, 2026
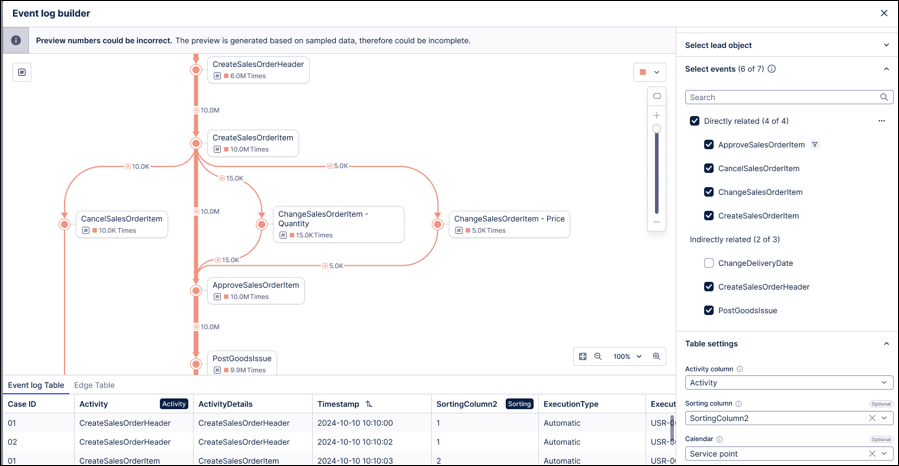
IMPROVED OBJECTS AND EVENTS Custom join paths added to Event Log builder
You can now specify the exact join path used to project events onto your lead objects. Defining these relationships explicitly ensures your KPI counts remain accurate and consistent across different data model loads by removing the risks associated with automated, shortest-path selection.
You can select a specific object-to-event (e2o) relationship from the new "Relate via" menu within the event configuration settings, which then saves this explicit path to the Knowledge Model to ensure deterministic log generation.
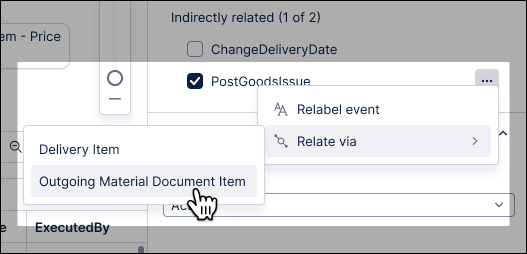
Previously, the CREATE_EVENTLOG operator defaulted to the shortest available path. While functional, this implicit behavior could lead to inconsistent KPI counts or unexpected results if your data model contained multiple paths of equal length.
To learn more about creating and configuring your event logs, see: Event logs (object-centric).
NEW STUDIO New customization options in Views
We've added these customization options in Views to give you greater flexibility over colors, icons, and text styling.
Color customizations
Views: Set the background color in a View, including the filter bar, from View Settings or by right-clicking within the View.
Views: Set the tab background color from Tab Settings or by right-clicking within the tab.
Containers: Set the background color or the header and background colors in containers.
Component headers: Set the color in any component that has a title enabled.
Component background color: Currently available for the Textbox and Button components only.
Icons
Access the full icon picker from Textbox and Button components, and component headers.
Color icons using color themes.
Text styling
Underscore, bold, italic, and alignment options are available in component and container titles, Chart axis titles, image and Iframe captions.
Full styling flexibility including headings and lists added for info tooltips.
May 28, 2026
IMPROVED OBJECTS AND EVENTS Table transformations added to Objects and Events workflows
You can now create and manage table transformations as part of your object-centric workflows. Table Transformations allow you to design, test, and execute custom table-level transformations directly within the Objects & Events interface, eliminating the need to pivot to isolated data integration tools.
For example, when optimizing Order-to-Cash workflows, pinpointing fulfillment delays caused by credit blocks is often hindered by inconsistent status codes across fragmented regional ERP databases.
Table transformations bridge this gap by enabling you to:
Target process pain points: Isolate and standardize data anomalies, such as mismatched regional status codes, directly within your OCPM environment.
Simplify SQL logic: Eliminate redundant
JOINoperations across massive transactional tables by creating a single, clean reference table.Leverage advanced SQL: Centralize Common Table Expressions (CTEs) to isolate specific business segments, such as filtering out low-value noise to focus strictly on high-risk orders.
Eliminate orchestration dependencies: You no longer need to orchestrate and coordinate multiple different data jobs with each other to complete pre-processing.
To learn more about creating and optimizing your table transformations, see: Table transformations.
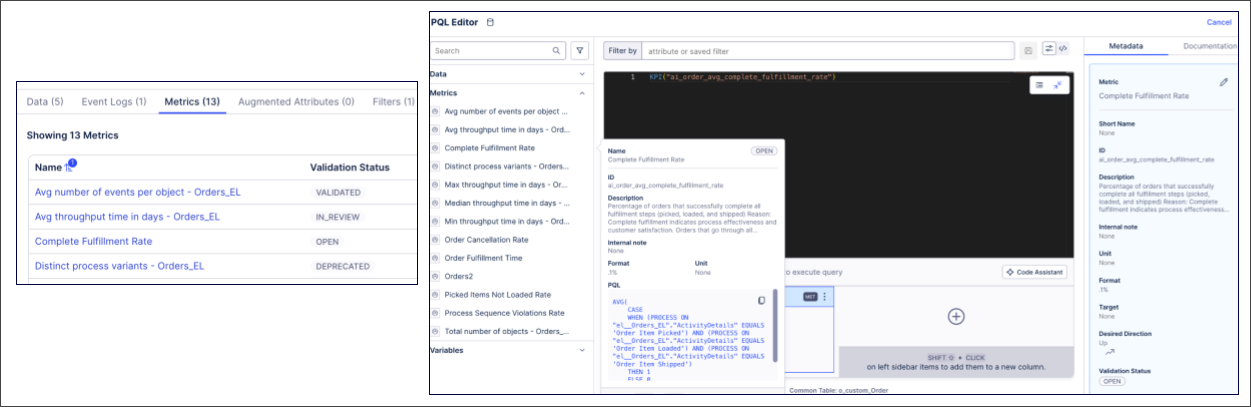
IMPROVED STUDIO PQL editor filtering aligned with Views filtering
We've extended the filtering options available in the PQL editor to give full alignment with filtering in Views.
Previously, you could only filter on data types and sources in the PQL editor, giving an inconsistent experience with the wider filtering options available in Views.
We've now extended the PQL editor filtering options to include attribute filters, process filters, saved filters, and filter chips, giving a consistent filtering experience across the PQL editor and Views.
Previously, for example, filtering in the PQL editor looked like this:
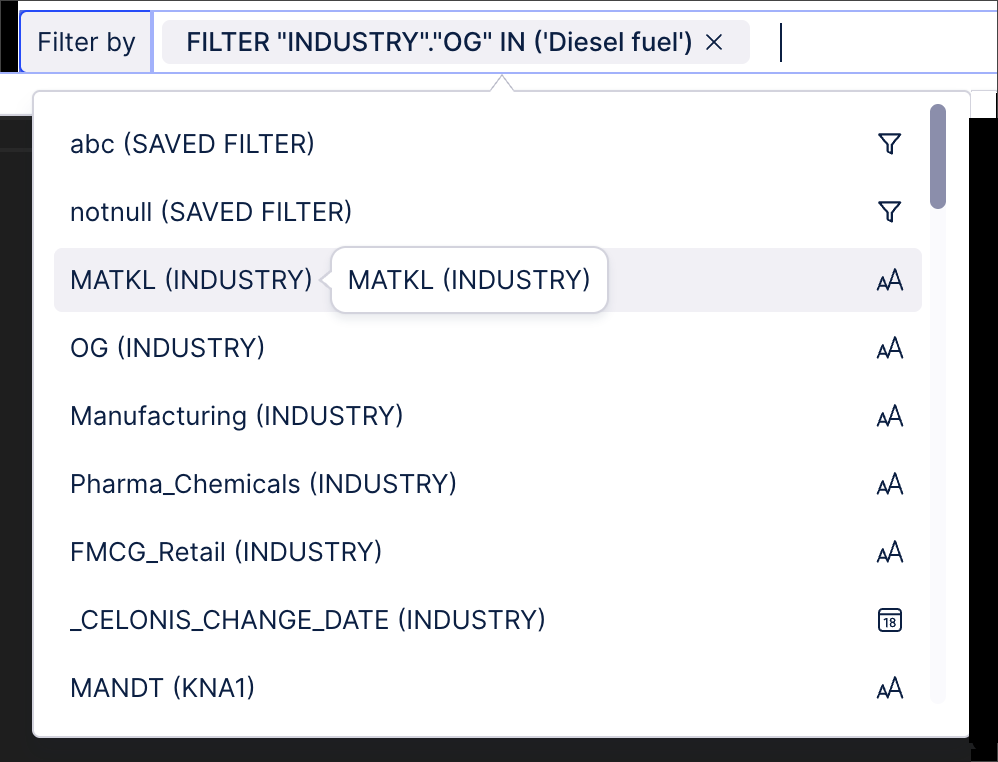 |
With these changes, the filtering options now align with those in Views:
 |
For more information about the PQL editor, see Using the PQL editor. And to find out more about filtering in Views, see Filtering Views.
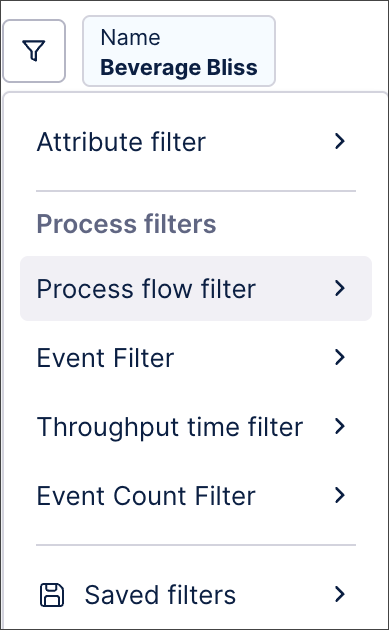
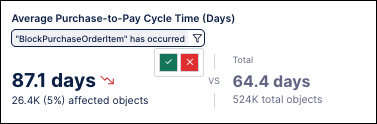
IMPROVED STUDIO User filter improvement in Views
We've made a small improvement to how user filter values are saved in Views.
Previously, if a user selected values in a filter selection menu and clicked outside the filter selection menu instead of clicking Apply, the selected values were automatically removed.
Now, the selected values are automatically saved as a user filter. The user can then confirm and apply or reject these filter values.
In this example, the user has selected two filter values:
 |
If the user doesn't select Apply and instead clicks outside the filter selection menu, the filter values are saved. The user can then click to confirm and apply or reject these filter values:
 |
For more information about filters in Views, see Filtering Views.
IMPROVED STUDIO Simplified annotation management in Augmentation tables
The process for maintaining Augmentation tables generated by Annotation Builders has been upgraded by adding a delete button to the Knowledge Model (KM) interface that allows you to remove outdated tables directly within the KM. This new button will make it easier to organize your existing outputs and delete any outdated annotations. Simplifying your annotation maintenance within the KM will help you conform to the latest naming conventions for new annotations by making it easier to remove existing outputs and delete outdated tables.
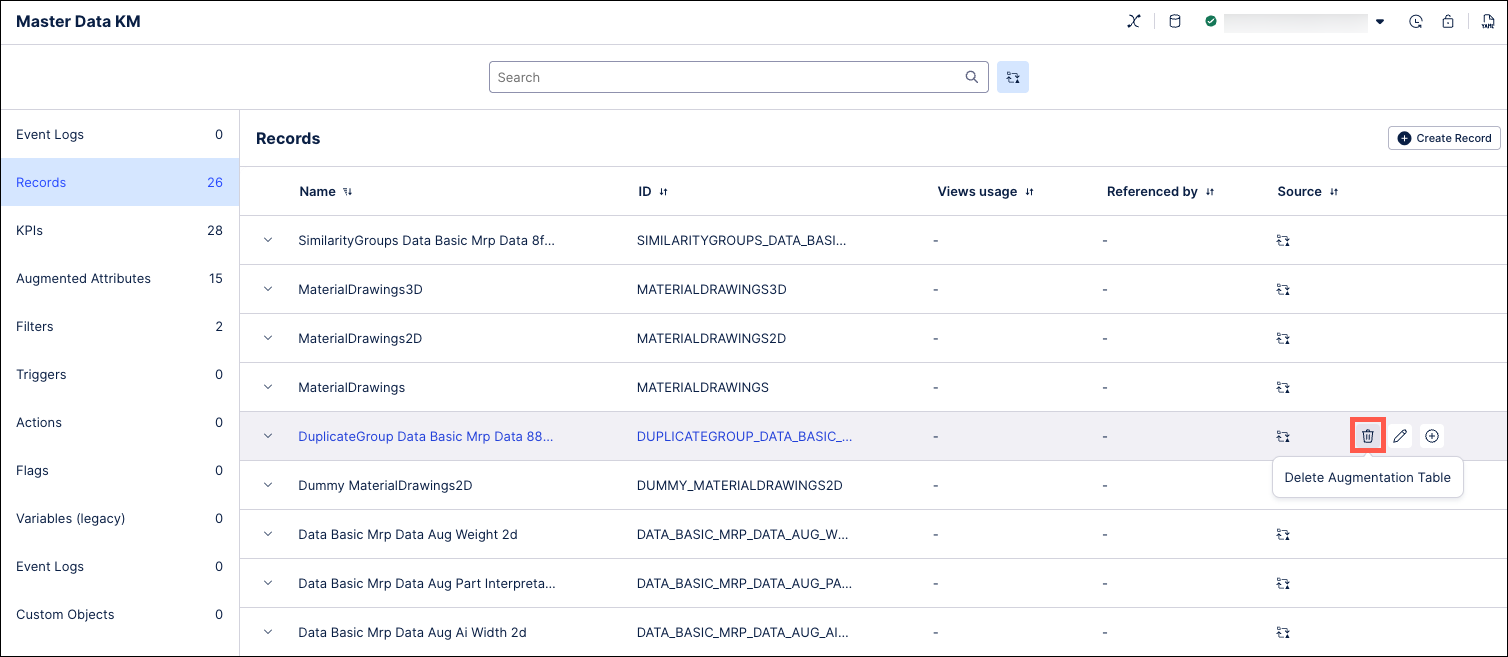 |
This new feature allows you to:
Keep your Knowledge Model organized: You can now easily delete Augmentation tables directly from within the Knowledge Model.
Remove outdated clutter: This solution addresses a previous limitation by allowing you to delete unneeded augmentation tables.
Optimize Data Model capacity: Remove deprecated annotation outputs to prevent workspace confusion and ensure you stay under the maximum limit of 200 augmentation tables per Data Model.
Note
Existing machine learning annotation outputs generated during the PrP phase do not follow the new naming conventions, which means that you will not be able to delete these outputs directly from within the Knowledge Model. Instead, you will need to re-run your Annotation Builder to create new tables with the new naming structure before manually deleting your outdated tables.
For more information, see Creating and using augmented attributes.
NEW STUDIO Message display added to View button components
You can now configure button components in Views to display a message when a user clicks a button.
You can add standard text formatting and URLs to the message text. The message text is accessible for screen readers and can be copied and pasted by the user.
In this example, a message has been added to the Read this button:
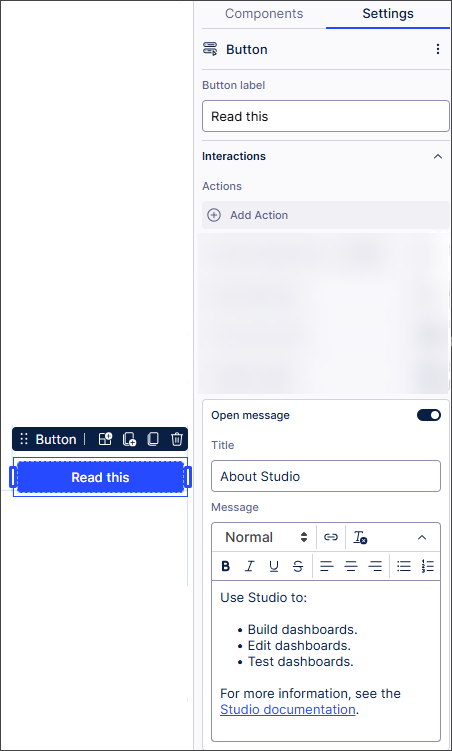 |
When the user clicks the Read this button, the message displays in the View:
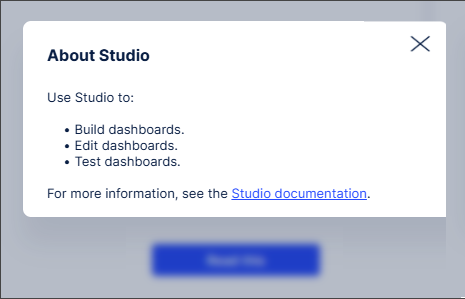 |
For more information about buttons in Views, see Buttons.
IMPROVED STUDIO Continuous processing of PQL queries in Views
We've improved how PQL queries are processed in Views.
Previously, PQL query responses were batched, with the slowest individual response defining the overall response speed of the batch.
PQL queries are now processed continuously, reducing PQL query response times. Users can also see data and interact with the View while complex queries are being processed for an improved user experience.
For more information about PQL queries, see Using the PQL editor.
May 26, 2026
IMPROVED PROCESS ADHERENCE MANAGER Intelligent event modeling & quality metrics
When adding events to an existing target model in Process Adherence Manager, events are now automatically mapped, placed in the best position in the model according to data. Previously, users had to do this manually. This improvement results in a guided experience that speeds up the time to insights and reduces the mental burden when defining a target model.
Additionally, the model editor now shows quality metrics when viewing a model. There are two essential metrics:
Precision: Measures how much behavior in the model is observed in the event log.
Fitness: Measures how much behavior in the event log can be replayed by the model.
These two metrics are now displayed in the model editor, plus per event log. After each model change (e.g. adding / removing an event), the metrics are updated and show the effect of the last change. This will help users create models that better reflect their data.
For more information, see: Making changes to a target model.
IMPROVED PROCESS NAVIGATOR Unified search experience
We've made some quality-of-life improvements to the search in Process Navigator:
When viewing a shared filter, a message now displays explaining where your saved filters are.
A back button has been added for deep-link user cases.
The "Apply filter" checkbox can now be found in the "My filters" dialog.
A handful of UI tweaks to clean up the overall search and filter experience.
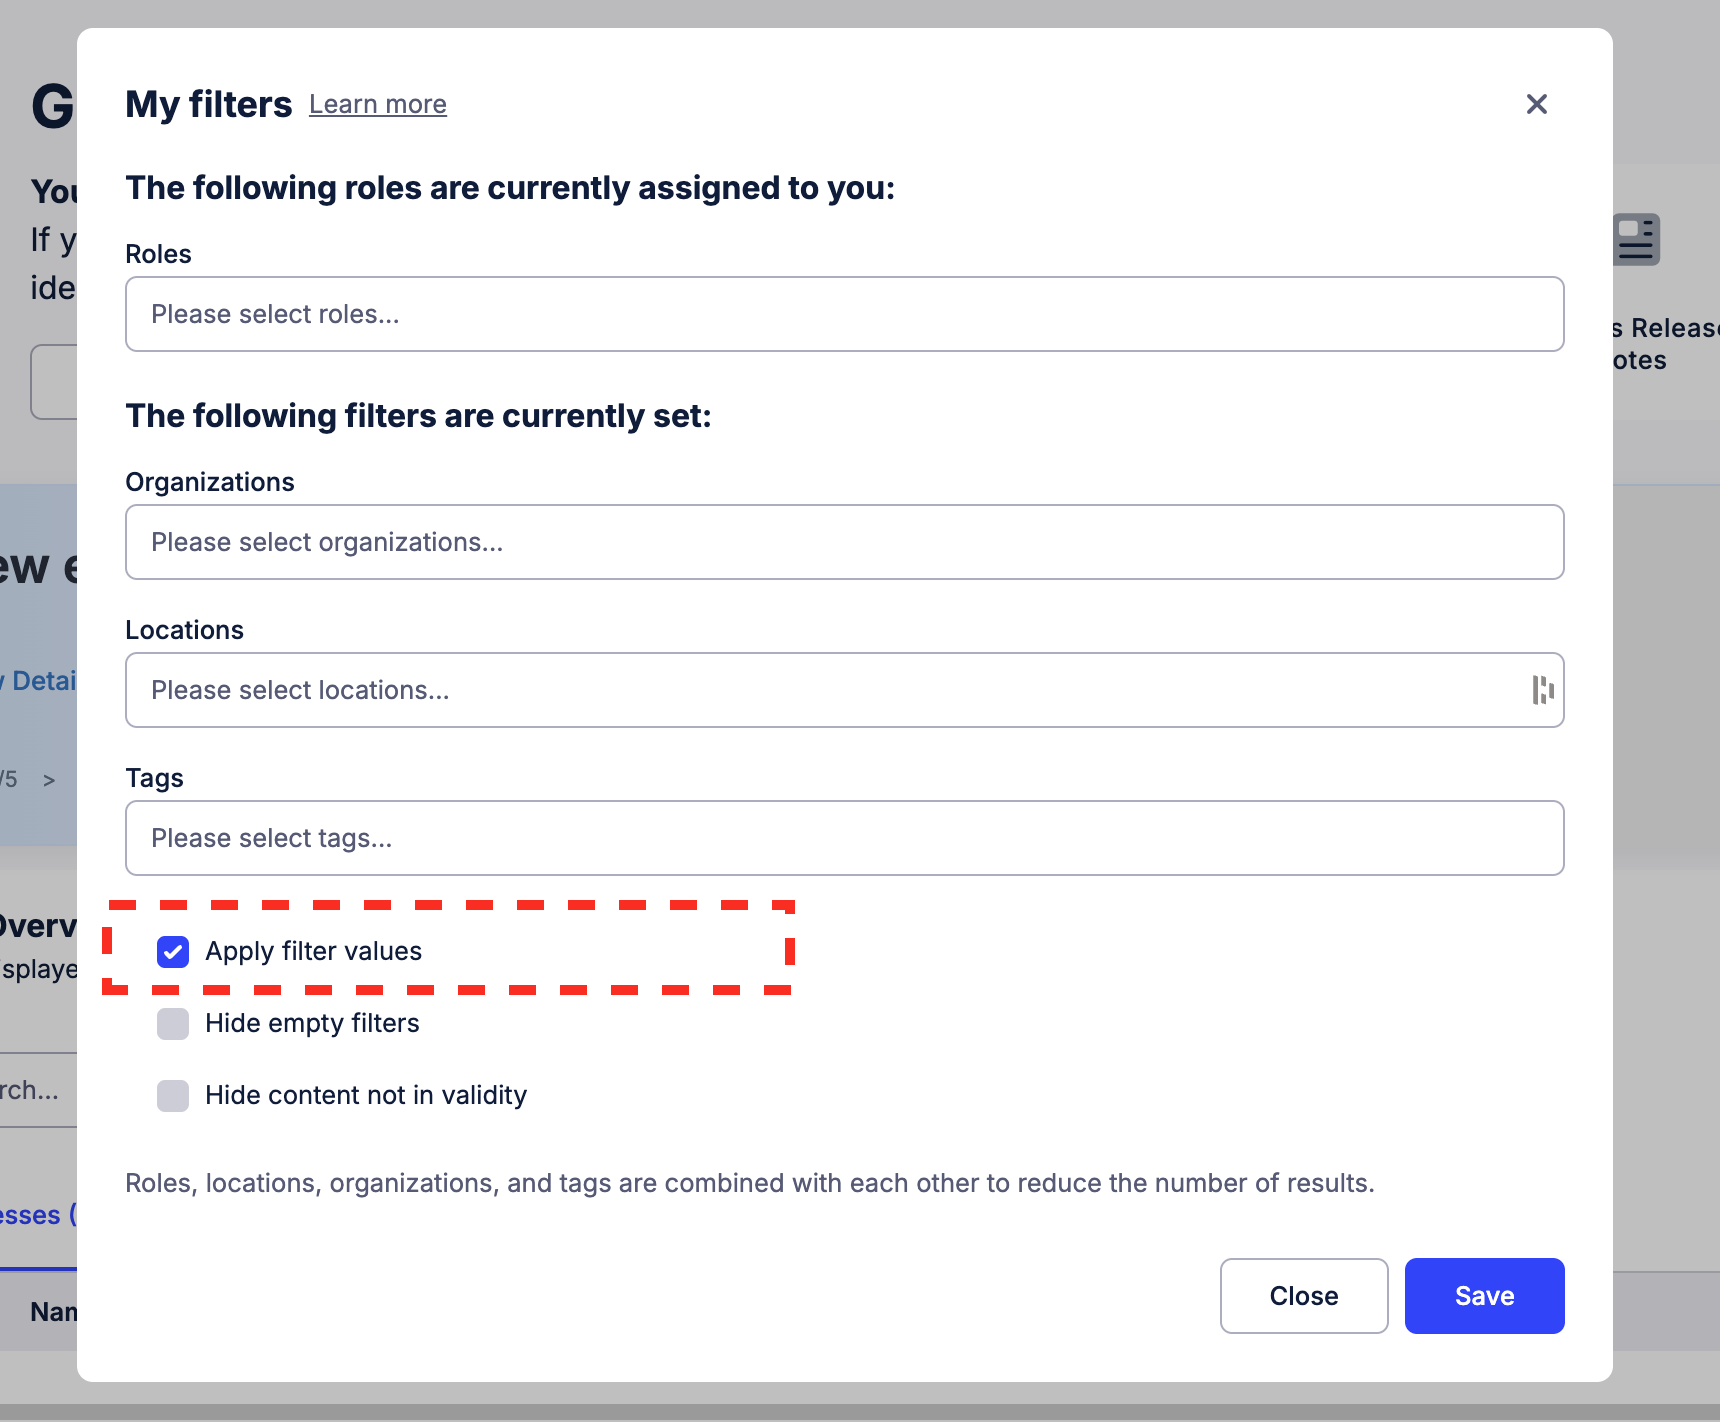 |
For more information, see: Searching and filtering in Process Navigator.
May 21, 2026
NEW STUDIO New temporary filters for Insight Explorer
Your filtering capabilities in Insight Explorer have been upgraded with temporary filters that allow you to perform a more in-depth analysis by applying a filter based on a specific insight. These temporary filters allow for the use of your own custom attributes. Using these temporary filters, you can go deeper into a group of object instances within a particular insight and then generate additional insights based on that group. This provides the ability to drill down further on any of the insights generated by your Insight Explorer.
These filters are applied by hovering on the filter for an insight and then clicking the filter icon on the right side. Clicking the Apply Filter button will create a filter based on the case cohort for this specific insight. This temporary filter can be removed at any time by clicking the filter icon again and clicking the Remove Filter button.
To learn more about Insight Explorer, see Generated insights.
IMPROVED STUDIO Upgraded Search Data tool for Process Copilots and MCP Assets
The search_data tool used in Process Copilots and third party agents to search data at the row-level has been upgraded with increased search options, customizable similarity thresholds, and other new functionality. These new functions include the option to search data using either the Keyword search (exact terminology match) or Semantic search (contextual meaning match). You can also customize your search results by setting similarity thresholds to help determine what your Large Language Model sees, returning just specified columns instead of full data rows, and applying a PQL filter to reduce the scope of your search results.
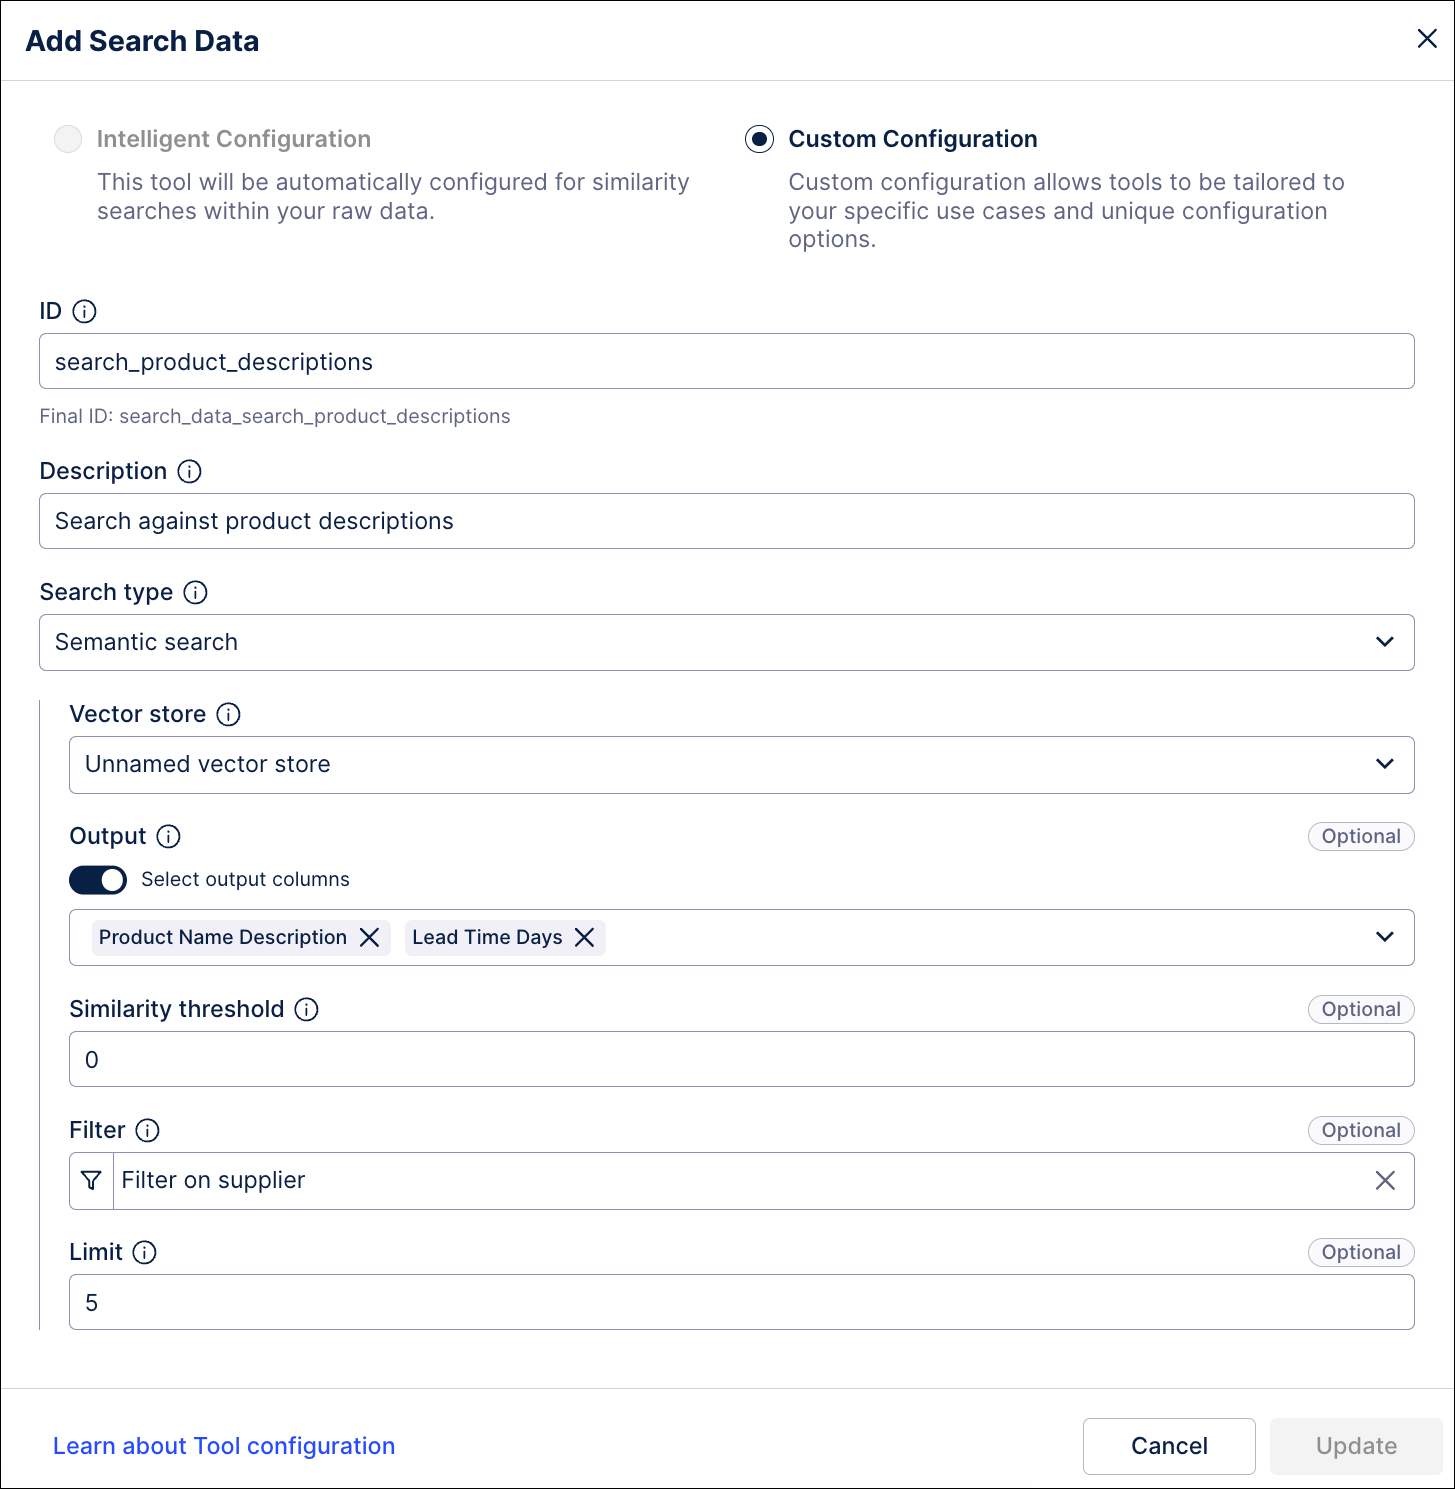 |
This upgrade allows the search_data tool to replace the existing document_search tool that had been previously used in Process Copilot configurations.
Note
Existing implementations of the search_data tool have been automatically migrated to utilize the new Keyword search mode. Existing implementations of the document_search and search tools configured with vector stores were converted to use the new Semantic search mode, retaining their vector-store IDs and attributes.
In addition to these newly added features, the interface for configuring the search_data tool in both Process Copilots and Agent Tools has been updated. For Process Copilots, the document upload functionality has been deprecated and the Documents tab was removed. The search_data tool configuration for Agent Tools was also changed to remove the Dedicated Metadata Search functionality that queries your Knowledge Model for YAML and other metadata. This feature is still available using the new search_metadata tool but is no longer part of the search_data functionality.
For more information, see 7. search_data — Search Data.
May 20, 2026
NEW DATA INTEGRATION Generic Database extractor now available
A new Generic Database extractor is now available that significantly expands the range of source systems available for data extraction. The Generic Database extractor empowers you to connect to niche or legacy systems that do not have a dedicated native connector in the Celonis Platform. Additionally, since the Generic Database extractor utilizes standard JDBC connections, you have greater control over your connection parameters via JDBC strings.
The Generic Database extractor also supports uplink and direct connections:
Uplink connections: For on-premise and private cloud environments, you can now configure practically any custom JDBC driver by uploading the required JAR files to your on-premise extractor, bridging the gap to your internal secure networks.
Direct connections: For cloud-based extractions, you can choose from a wide range of natively supported JDBC drivers or request new drivers be added to the Celonis environment to meet your specific architecture needs.
For more information, see: Generic Database.
PRIVATE PREVIEW TASK MINING Task Discovery using AI
We've added AI-based Task Discovery as a private preview feature.
In Task Mining, user actions are captured at desktop level by the Task Mining Client software. The volume of user actions captured can make it difficult to relate different user actions to actual business tasks.
With AI Task Discovery, you can create goals and add instructions for an LLM which then automatically organizes user actions into tasks and sub-tasks. This adds business context, making it easier to analyze the data captured.
We've also created a customized template that lets you quickly and easily view data specific to AI Task Discovery in the Workforce Productivity app.
For more information, see Grouping Task Mining events into Tasks (Task Discovery).
And to find out more about our private preview releases, see Feature release types.
May 19, 2026
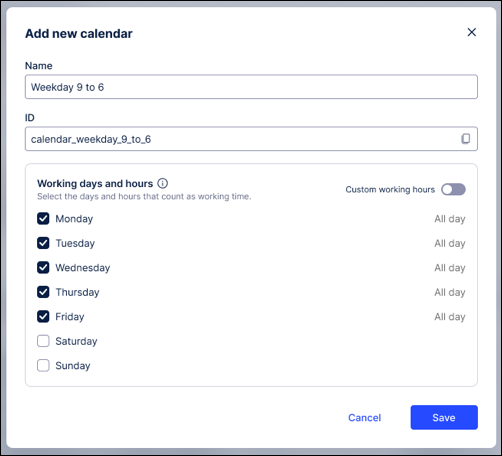
IMPROVED STUDIO Calendar based throughput times in Studio
Standard throughput time (TPT) calculations often include weekends, public holidays, and leave days. For processes like insurance claims or procurement, this "gross" time leads to skewed metrics and inaccurate efficiency insights. To make your object-centric process data more realistic, we’ve integrated calendar configuration directly into the Event Log Builder. This replaces the fragmented setups with a centralized, streamlined process for defining "net" working hours.
By integrating the calendar configuration, you gain the following benefits:
Knowledge Model Integration: Calendars are now stored as reusable entities within the Knowledge Model, ensuring a single source of truth across your workspace.
Workload framework and PQL: Leverage the workload framework to reference calendars directly via PQL for advanced custom calculations.
Auto-populated insights: These calendars are automatically utilized by Process Explorer, TPT components, and View components to provide accurate, out-of-the-box process mining knowledge.
To learn more about configuring a calendar for your event logs, see: Event logs (object-centric)
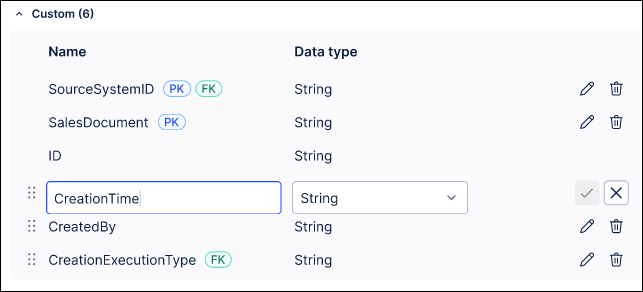
IMPROVED OBJECTS AND EVENTS Edit attribute names and data types directly
You can now rename attributes and update data types for both objects and events without losing your work. This update eliminates the need to manually delete and recreate attributes, ensuring your creation order remains intact and saving you significant manual effort.
When editing attribute names and data types, you're also prompted to manually update any relevant dependencies.
To update your attributes, click the attribute name or data type, enter your changes, and save.
To learn more about creating and managing objects and events, see: Modeling objects and events.
May 15, 2026
NEW PLATFORM Filtering added to Release Notes
You can now filter and bookmark our release notes to quickly locate specific updates. The filtering panel gives you the following options:
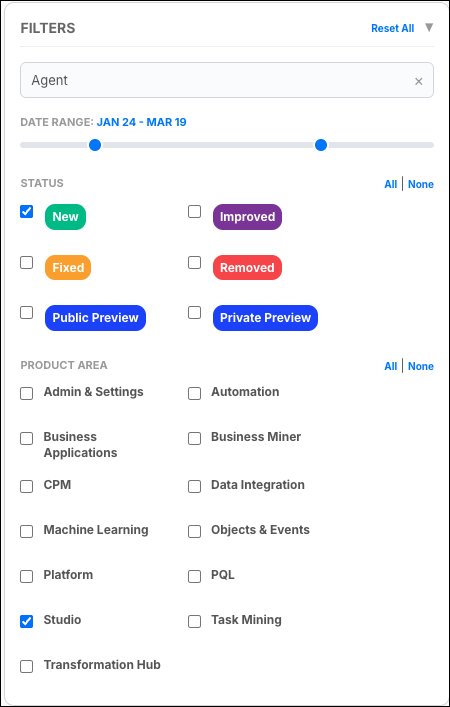
Text search: Use the search bar to find release notes containing specific keywords.
Date range: Adjust the slider to limit the view to updates published within a specific timeframe.
Release types: Filter by the type of release. Options include New, Improved, Fixed, Removed, Public Preview, and Private Preview.
Product Area: Filter updates by specific product features or components (e.g., Admin & Settings, Data Integration, and Studio).
Persistent URLs: The page URL updates automatically as you apply filters. You can bookmark the URL to save your customized view or share it with others.
You can clear individual filter categories using the All / None toggles, or clear all active filters at once using the Reset All button.
To learn more about our Celonis Platform release types, see: Feature release types.
May 14, 2026
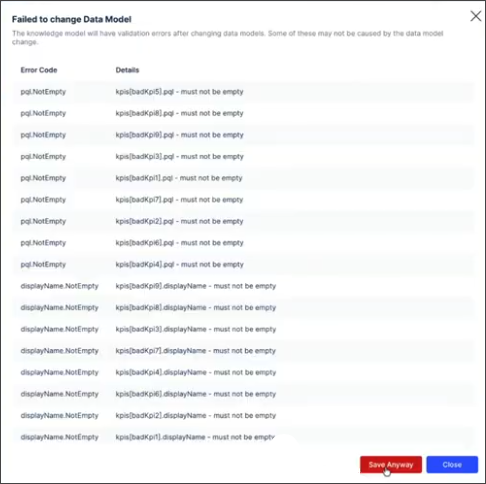
IMPROVED STUDIO Validation error improvements when changing Data Model
We've added additional context to help you resolve validation errors when changing the Data Model used by a Knowledge Model.
Validation checks are run to ensure the Knowledge Model will still work correctly with the new Data Model.
Previously, if the validation checks failed, a single, generic error message displayed and the Data Model change was automatically blocked.
Now, more detailed error messages display in a scrollable list, allowing you to review and resolve the generated validation errors. You can also change the Data Model even where validation errors occur, allowing you to fix the errors later on.
 |
May 13, 2026
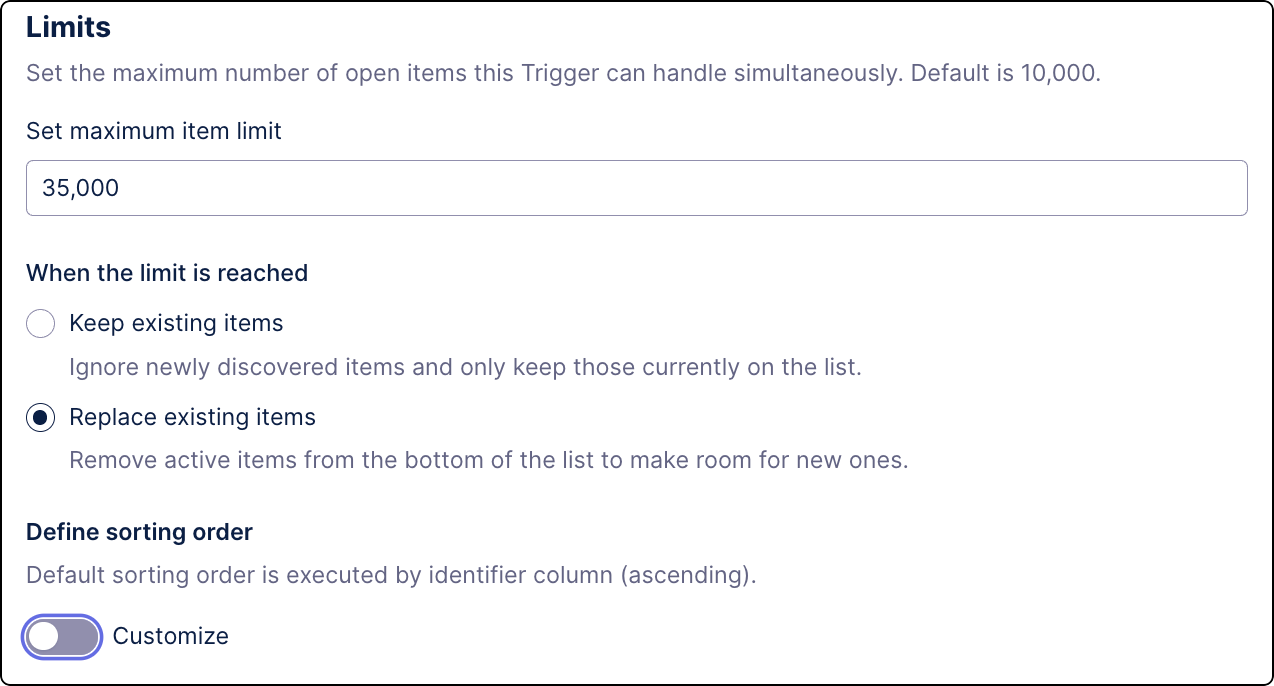
IMPROVED AUTOMATION Changes to Data Model Triggers
To better control your automations, you can now define a limit on how many items a Data Model Trigger can handle. Whenever that limit is reached, depending on your settings, new items discovered in the Data Model are either ignored or they replace the low-priority items.
For more information, see Creating Triggers using Data Model.
May 12, 2026
IMPROVED STUDIO Changes to the Knowledge sidebar in the PQL editor
We've made some changes to the Knowledge sidebar in the PQL editor to make it easier to work with the aggregation selector. We've also changed the edit button location for filters and variables in the PQL editor Knowledge sidebar to improve alignment with other entities.
Row-click action removed
Previously, clicking anywhere in an entity row in the Knowledge sidebar automatically added the entity's PQL expression to the currently-selected table column:
 |
Now, you use the new insert button to add the PQL expression to a table column:
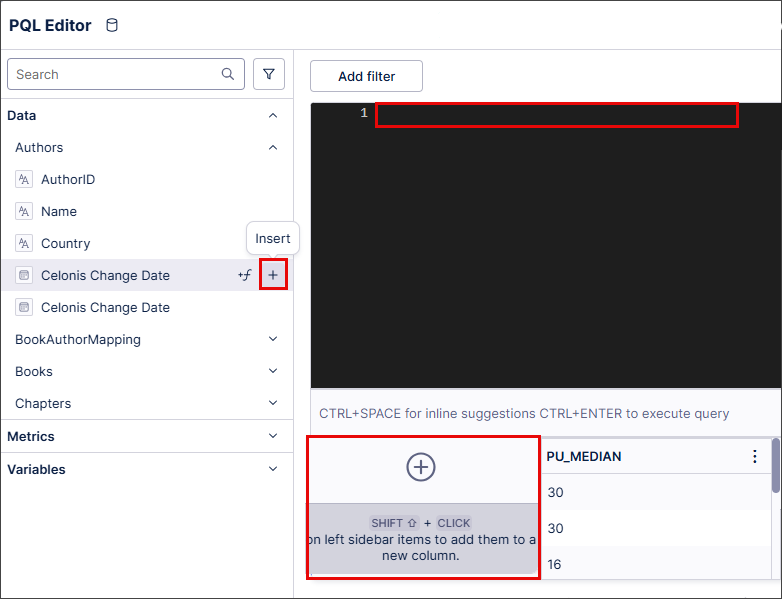 |
Metadata popover action changed
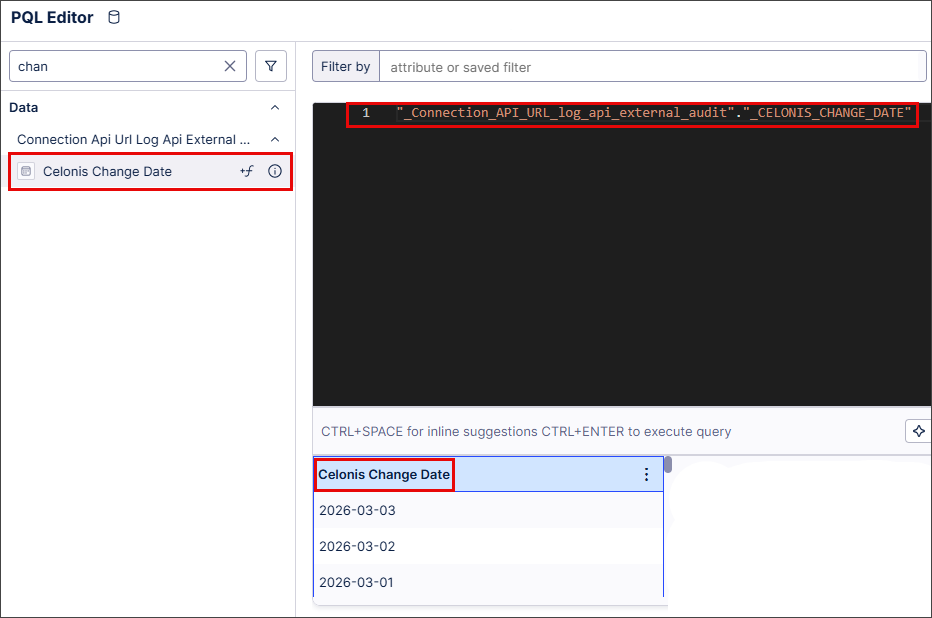
Previously, you accessed metadata popovers for an entity by clicking the info button:
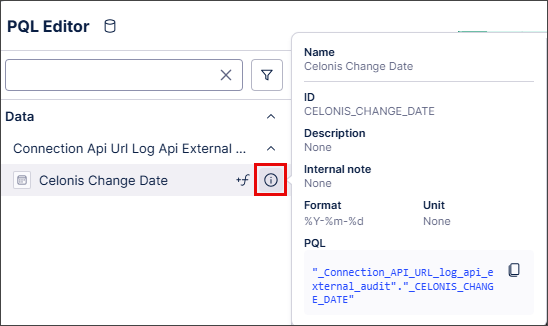 |
Metadata popovers now appear automatically when you hover over an entity:
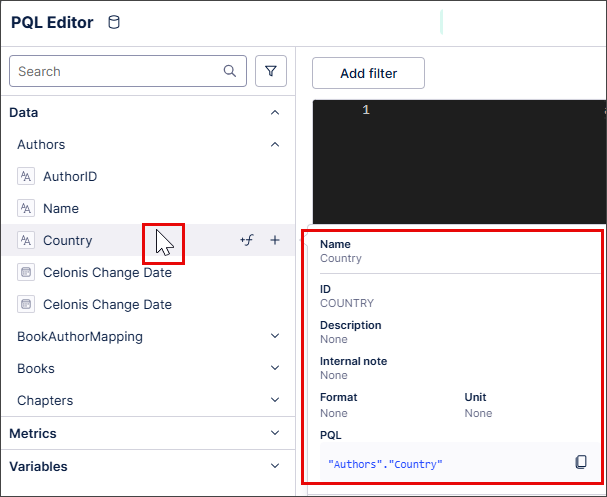 |
Edit buttons relocated for filters and variables
Previously, you edited filters and variables in the Knowledge sidebar using an inline edit button. This button has been removed and an edit button added instead to the metadata popover.
 |
All other functionality and logic are unchanged.
For more information about the PQL editor, see PQL editor.
May 11, 2026
PUBLIC PREVIEW STUDIO Process Explorer enhancements
We’ve made the following usability improvements to the Process Explorer component in Studio:
We’ve removed the limitation on how many events are displayed in Process Explorer. The list of events now displays all available events, with the most relevant 5000 events displayed first.
You can use the search bar to find any events in your event logs.
Events on the list that are not visible in the Process Explorer graph are now marked with a filter icon.
For more information, see Show / Hide events in PE.
May 8, 2026
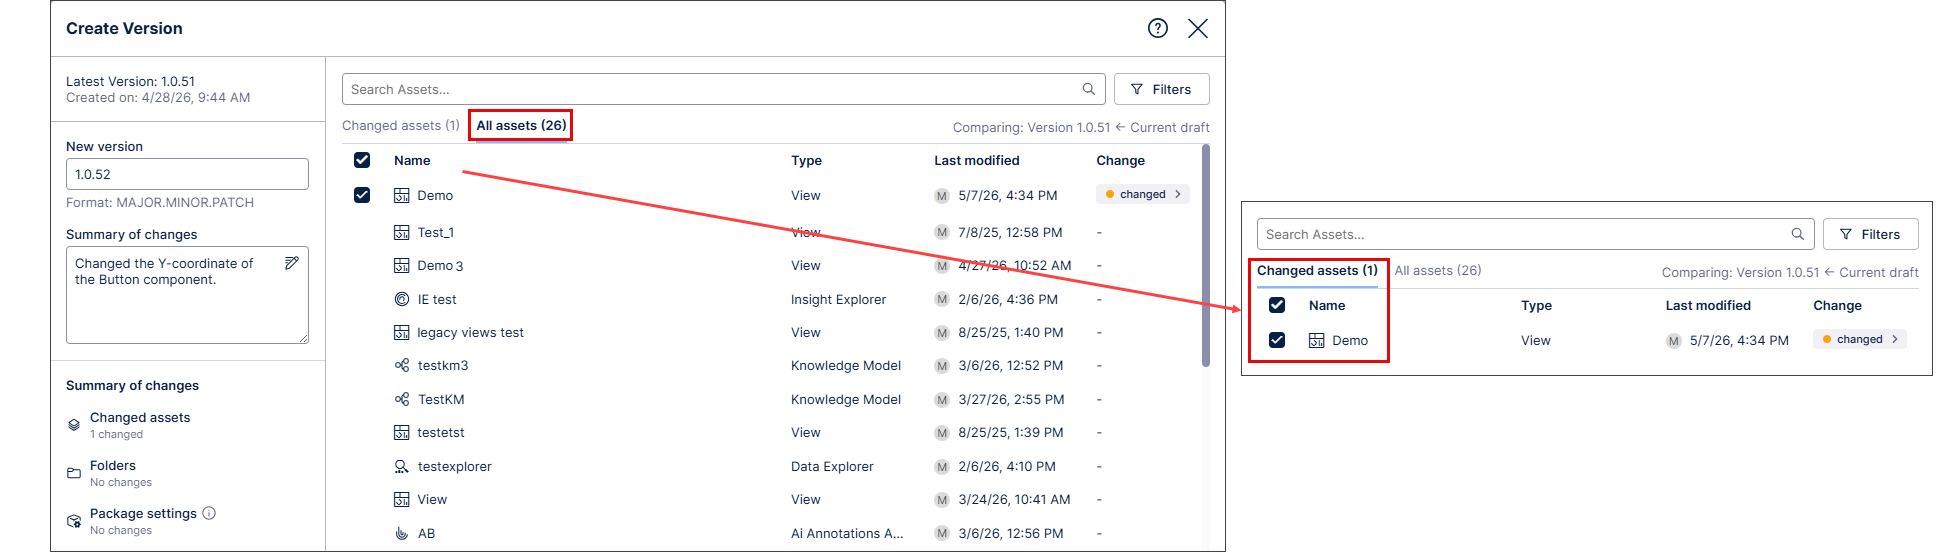
IMPROVED STUDIO Increased transparency for Studio package versioning changes
When you create a new version of a Studio package, you can now see exactly what's changed using two new tabs in the Create Version screen:
Select the All assets tab to see all the assets in your package.
Select the Changed assets tab to see any assets that have changed from the previous package version.
 |
The Create Version screen also displays information about the versions being compared:
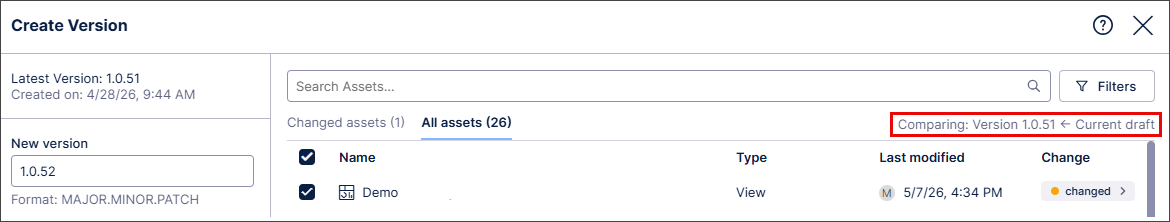 |
You can also view the exact changes between these versions by selecting changed in the Create Version screen:
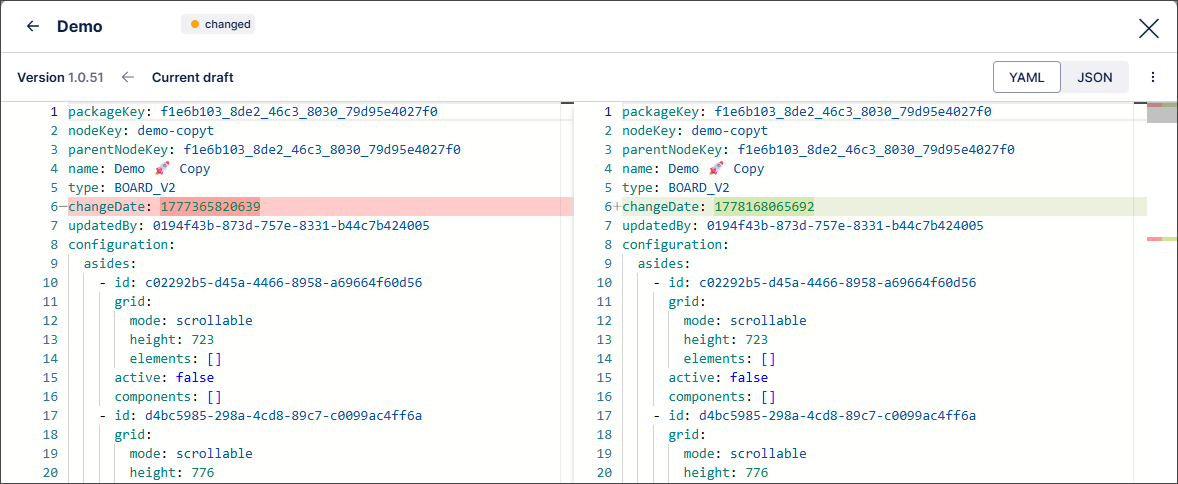 |
For more information, see Versioning and deploying packages.
May 7, 2026
PRIVATE PREVIEW DATA INTEGRATION Share Celonis data externally via Delta Sharing
You can now securely and efficiently share process intelligence data from your Celonis Data Pools with external platforms in your data ecosystem using Outbound Data Sharing. This connection leverages the Delta Sharing open standard to transform Celonis into your organization’s central Intelligence Layer, providing third-party tools like Databricks with seamless access to process-contextualized data.
Optimized for the Object-Centric Process Mining (OCPM) framework, Outbound Data Sharing allows you to export your Object and Event tables to maintain semantic integrity across your entire data stack. By sharing these business-ready outputs, you can now power cross-platform use cases and advanced analytics. This ensures your process context remains consistent and actionable outside of the Celonis environment.
For more information, see Outbound Data Sharing.
To learn more about our private preview release, see: Feature release types.
May 6, 2026
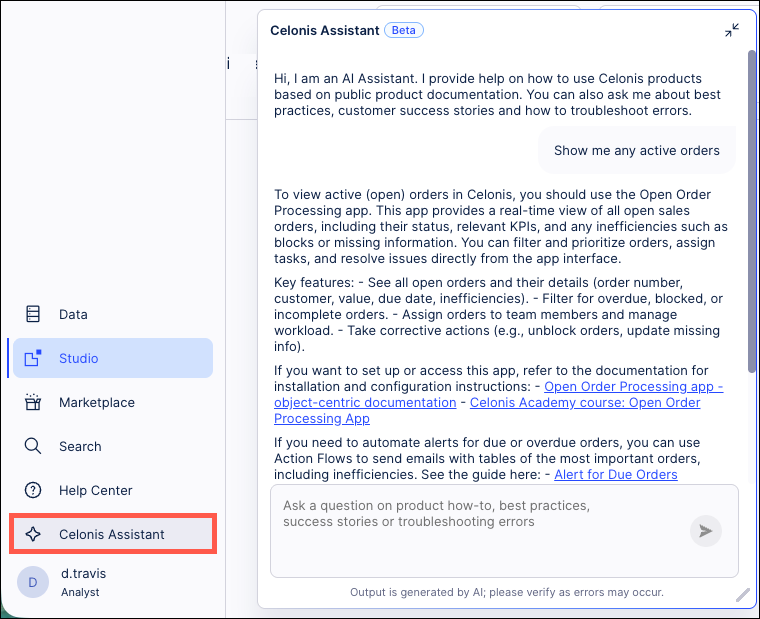
PRIVATE PREVIEW PLATFORM New Celonis Assistant available in Private Preview
The Celonis Assistant is an AI support assistant that offers a conversational chat interface to help configure your Celonis implementation in real-time. It is context-aware and has access to public documentation of the platform and latest product guidance. This assistant can provide suggestions on which Celonis products to use, suggest use cases and KPIs to analyze within your data, provide implementation guidance, and more.
As you begin your Celonis implementation, the Celonis Assistant offers guidance on how to get started, provides best practices for your configuration, and helps to troubleshoot any errors. As you prioritize which use cases you want to improve, the Celonis Assistant can identify prebuilt solutions that meet your needs or guide you as you build custom solutions on the Celonis Platform.
To use the Celonis Assistant, you will need to enable AI Settings and Azure OpenAI models for your team. The Celonis Assistant can then be accessed from the main Celonis menu by clicking the “Celonis Assistant” option.
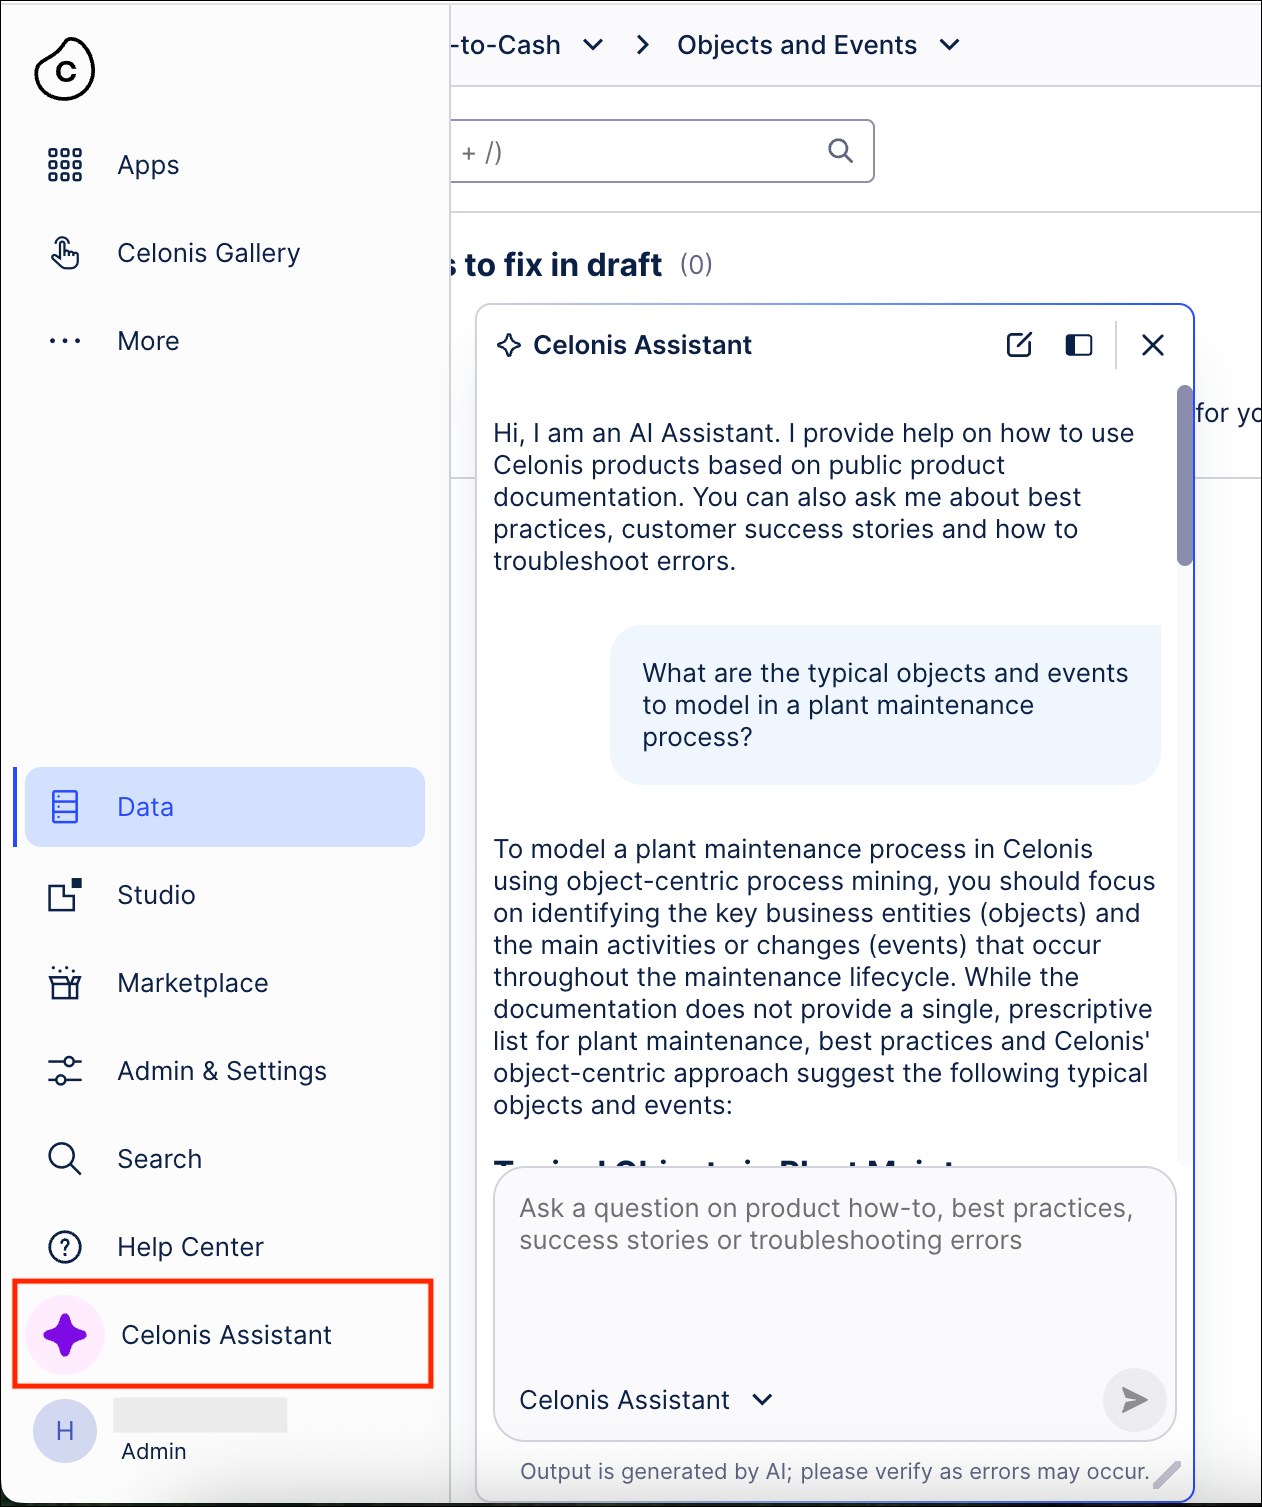 |
For more information, see Celonis Assistant.
And to read more about our private preview releases, see Feature release types.
IMPROVED OBJECTS AND EVENTS Objects and events assets added to team-to-team copy
You can now copy your object-centric process mining (OCPM) data models (OCDM) and data pools between Celonis Platform teams using the Team-to-team copy feature. This feature also team admins to select the team to copy assets into (known as the target team), check and resolve asset dependencies, and run the copy.
When copying Objects and Events assets, the following applies:
Object-centric process mining (OCPM) data pools are always copied together with their OCDM configuration; copying OCDM alone is not supported.
The OCDM version deployed to production in the source data pool is copied. Individual OCDM assets (objects or events) cannot be copied.
A successful team-to-team copy creates a new OCDM version in the target team, but it is not automatically deployed.
Data pools can be copied to an existing or new data pool in the target team. Once established, this mapping is permanent.
When copying to an existing target data pool, the OCDM version history is reset to 0.0.1 on the first copy.
For more information about the team-to-team copy feature, see: Team-to-team copy.
May 4, 2026
NEW STUDIO Consistent event log colors across all Process Mining components
We've made some changes so event log colors are now consistent across all Process Mining components and assets.
When a color is assigned to an event log in the Event Log Builder or visual editor, that color is now be used for that event log in all your Process Mining components, such as Process Explorer, Variant Explorer, Process Adherence Manager (PAM), Event Explorer, Case Explorer and Throughput Time (TPT) Explorer, as well as in any associated process filters.
If the assigned color is changed in the Event Log Builder or visual editor, the event log color will update automatically across all components.
We've also refreshed the color palette used for event logs so it's easier to distinguish between the colors available, while also improving the accessibility of colors used in Process Mining components.
April 30, 2026
PRIVATE PREVIEW STUDIO Annotation Builder supports direct writebacks to the Process Intelligence Graph
Annotation Builder support for direct writebacks to the Process Intelligence Graph (PI Graph) is now available in Private Preview. Using this feature, you can write AI-generated annotations, such as risk scores, categorizations, and extracted entities, directly into your Object-Centric Process Mining (OCPM) data models as first-class attributes. Previously, enriching data with AI outputs at scale required manual workarounds or was constrained by the 200,000-row limit of Augmented Attributes. With this release, we have built an enterprise-grade pipeline that handles high-volume data enrichment automatically.
By persisting Annotation Builder results natively in the data model, your AI-enriched data is instantly reusable across multiple workspaces, downstream applications, AI Agents, and Action Flows. This eliminates complex data integration bottlenecks and ensures a single source of truth for your AI-generated insights.
This feature also includes:
Direct OCPM Integration ("PIG Mode"): Exclusively available for Object-Centric data models, this feature allows you to map large language model (LLM) outputs directly to existing PI Graph objects.
Enterprise-Scale Upserts: Built to handle massive datasets, the system securely batches and pushes large volumes of annotation data into dedicated, managed Data Pool tables (e.g.,
ai_annotations_<source>_<output>).Automated End-to-End Pipeline: Following a successful LLM run, the system automatically updates the entity's SQL factory, creates a new package version, and triggers an OCPM data job to reload the model with your new annotations. No manual data engineering required.
To use this feature, you must have Data Integration permissions. Then when configuring a new Annotation Builder model, you will need to select your target OCPM entity in the setup wizard to enable native PI Graph writebacks.
For more information, see PI Graph Writebacks.
To read more about our private preview releases, see Feature release types.
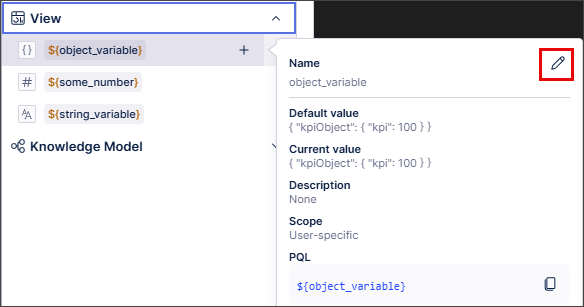
IMPROVED STUDIO Smart inputs extended to Knowledge Model metadata
You can now use smart inputs in View modules to retrieve Knowledge Model metadata.
With this additional functionality, you can now write the metadata for any KPI attribute to the View module variable mapping. This lets you use KPI information directly from the Knowledge Model instead of hard coding inputs.
For more information, see the Object variable use case example.
REMOVED BUSINESS MINER Business Miner service removed
Our Business Miner service has been removed from the platform and has already been replaced by our AI-driven Insight Explorer and Studio features.
With these advanced capabilities, you’ll benefit from:
Enhanced intelligence: Advanced AI integration and deeper customization options.
No additional cost: These features are already included in your Celonis Platform offering and can be used today at no extra cost.
Easy transition: With our Celonis Academy course, you can efficiently transition away from Business Miner.
To learn more about Insight Explorer, see: Insight Explorer
April 29, 2026
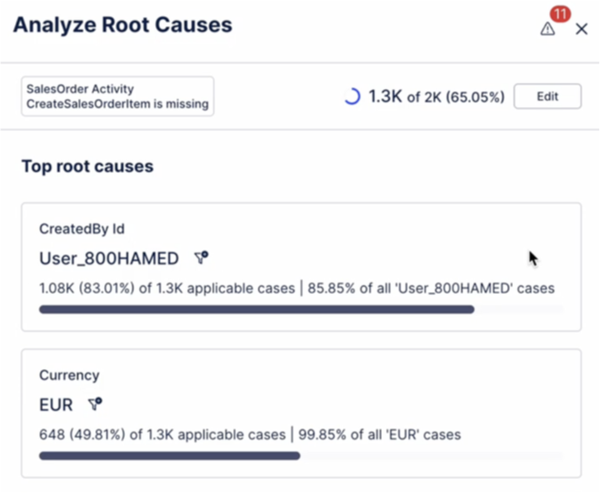
IMPROVED PROCESS ADHERENCE MANAGER Filtering root causes in Adherence Explorer
You can now filter root causes when analyzing deviations in Adherence Explorer. This allows users to see the impact of a particular deviation root cause on a KPI.
 |
To learn more about Adherence Explorer, see: Adherence Explorer.
April 28, 2026
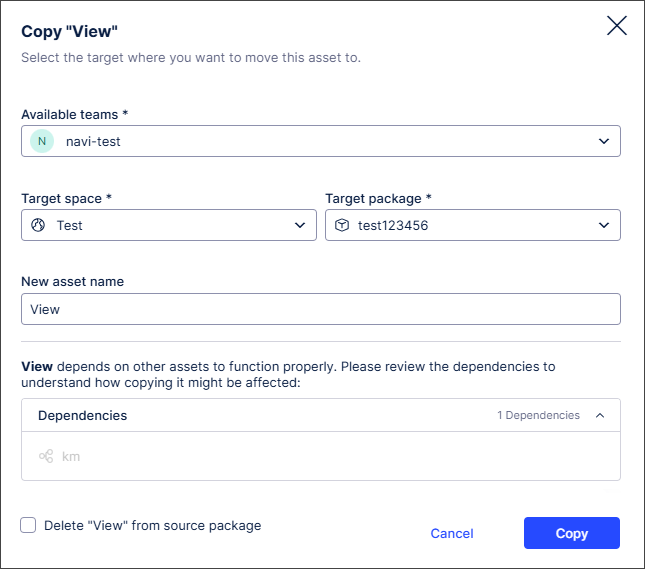
IMPROVED STUDIO 'Copy to' alignment for packages and assets
We've redesigned the Copy to modal for packages so it aligns with the Copy to modal for Studio assets, giving you a more consistent and intuitive experience.
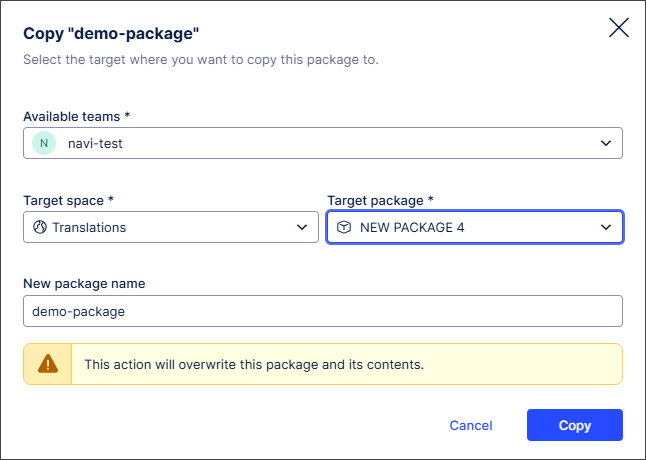
We've also added 'lazy loading' where checks for unversioned changes are now made only after a package has been selected. This reduces loading times, improving system performance.
To learn more about creating and managing Studio packages and assets, see: Packages
NEW TASK MINING Task Mining Client software version 2.21.1
We've released a new version of the Task Mining Client software. This version includes enhanced internal message handling. We've also removed legacy, unused decryption paths related to protected Windows data. There are no changes to your sign-in process or how your data is protected.
For more information, see the Task Mining install file release notes.
April 27, 2026
NEW STUDIO Performance Spectrum component added to Views
You can now add and configure a Performance Spectrum component for your Studio Views.
Previously available as a public preview, the Performance Spectrum adds a time-based perspective to your Views, revealing how tasks interact and evolve. It highlights variations, bottlenecks, and performance shifts that are often hidden in aggregations, giving you clearer insights into how your processes truly run.
In this example, the Performance Spectrum helps a government agency to visualize how individual fines move through a defined sequence over time. This helps them to identify bottlenecks and validate that specific process patterns (like batching) are adhered to and stay consistent over time (e.g. throughout the year).
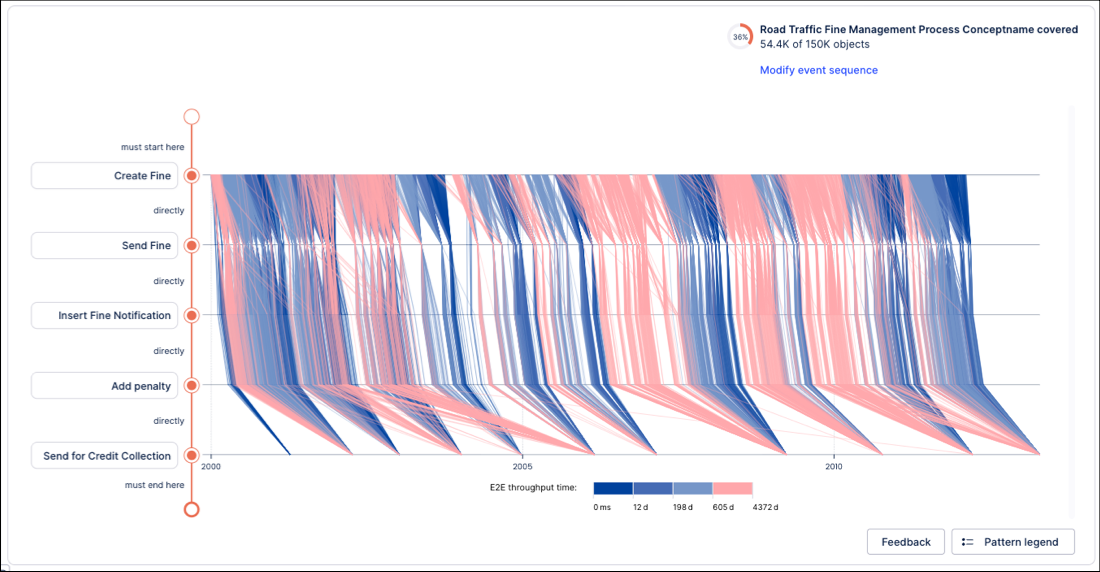 |
To learn more about the Performance Spectrum, see: Performance Spectrum.
NEW STUDIO Object-centric Instance Explorer component added to Studio Views
You can now configure an Instance Explorer component for your object-centric data in your Studio Views. The component, previously in public preview, lets you explore individual object instances, like Orders, Invoices, or Flights, and their events within the digital twin. You can see each object’s lifecycle and relationships without creating custom queries or tables.
The key features include:
Search by ID: Inspect objects by their unique identifiers and view their full lifecycle and relationships.
Investigate case behavior: See object relationships and event sequences to understand current states.
Verify data representation: Check how source system data is represented and share with stakeholders.
The Instance Explorer component can be viewed using a graph or list view, with an example of the graph view displayed here:
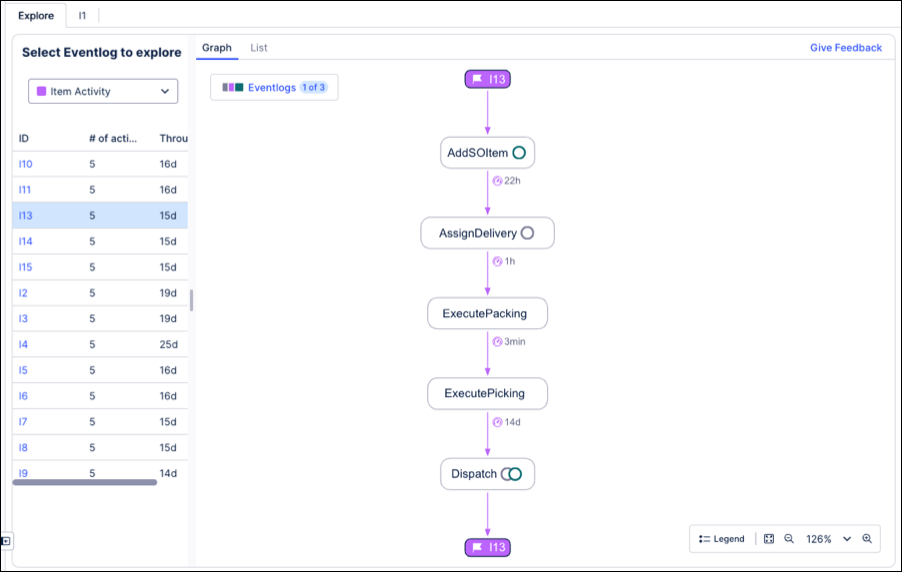
To learn more about configuring and using the Instance Explorer component, see: Instance Explorer.
April 23, 2026
PRIVATE PREVIEW STUDIO Message display added to View button components
With this private preview release, you can now configure button components in Views to display a message when a user clicks a button.
You can add standard text formatting and URLs to the message text. The message text is accessible for screen readers and can be copied and pasted by the user.
In this example, a message has been added to the Read this button:
|
When the user clicks the Read this button, the message displays in the View:
|
For more information about buttons in Views, see Buttons.
And to read more about our private preview releases, see Feature release types.
April 22, 2026
PUBLIC PREVIEW STUDIO User language preferences added for Analysis to Views migrations
We've extended Data Model name mapping to Knowledge Models so user language preferences are automatically applied in Views, for example when migrating Analyses to Views.
Previously, when an Analysis was migrated to a View, translations based on user language preferences were not available. This led to a poor user experience as the table and column names displayed in the View were potentially different from those in the original Analysis.
By extending support for name mapping, table and column names now automatically display in the default language selected by the user in the Studio package settings. This applies to all Views, including Views that were migrated from Analyses.
For more information, see Migrating translations from an Analysis to a View and Managing package settings.
And to read more about our public preview releases, see Feature release types.
NEW PQL New PQL aggregation functions for distinct string concatenation
PQL now supports two new functions for concatenating unique string values into a single result: STRING_AGG DISTINCT and PU_STRING_AGG_DISTINCT. These functions allow you to summarize multiple string entries into a single list of unique values.
STRING_AGG DISTINCT: Acts as a standard aggregation, returning the unique values from a source column within a specific group.PU_STRING_AGG_DISTINCT: Acts as a pull-up aggregation, allowing you to pull concatenated unique values from a source table up to a target table. This is ideal for creating per-case or per-object summaries of unique activities.
Both functions support an optional ORDER BY clause to control the sequence of the concatenated results. Additionally, PU_STRING_AGG_DISTINCT supports an optional filter expression to refine which source rows are included in the aggregation.
For more information, see the STRING_AGG DISTINCT and PU_STRING_AGG_DISTINCT documentation.
NEW PQL New PQL WITH clause for organized and reusable query logic
PQL now supports the WITH clause, enabling you to define temporary table aliases and named expressions directly within queries. This allows you to encapsulate complex logic into reusable blocks, significantly improving the structure and maintainability of sophisticated PQL statements.
To provide flexibility in how you define your logic, the WITH clause supports two distinct declaration methods:
REGISTER: Creates a temporary alias for a table or assigns a named PQL variable (prefixed with@) to a specific column expression or condition.EXTEND: Dynamically attaches a computed column to an existing table for the duration of the expression, allowing you to treat derived logic as a native part of the table schema.
For example:
WITH [
  REGISTER "EventLog" AS CREATE_EVENTLOG ( "ObjectTable" ),
  EXTEND "EventLog" WITH "CustomAttribute" AS "EventLog"."Attribute" + 1
] ( "Eventlog"."CustomAttribute" + 2 )
The declared names are strictly local to the immediate expression. They are not visible outside of it, and the same identifier can be redeclared with a different meaning in a separate expression without conflict.
For more information, see the WITH clause documentation.
April 21, 2026
PRIVATE PREVIEW DATA INTEGRATION OIDC authentication for Delta Sharing is now supported
Delta Sharing connections now support OIDC (OpenID Connect) Federation authentication. This allows you to connect your Celonis Platform pools to external Databricks shares without the need for static, long-lived bearer token files. This makes your Delta Sharing connections more secure and easier to manage.
For more information, see Delta Sharing.
April 13, 2026
IMPROVED OBJECTS AND EVENTS Process Explorer preview added to Event Log builder
We've added a Process Explorer preview to the Event Log builder. This allows you to visualize your process model in real-time during configuration, ensuring accuracy between the data model and the intended process flow. The preview includes auto-refresh capabilities and supports the visualization of dynamic events.
Previously, you had to save the Event Log and navigate to a separate View to verify your process flow. Now, you can spot mapping errors, like inverted timestamps or incorrect activity naming, instantly without leaving the builder.
To learn more about creating and configuring event logs, see: Event logs (object-centric).
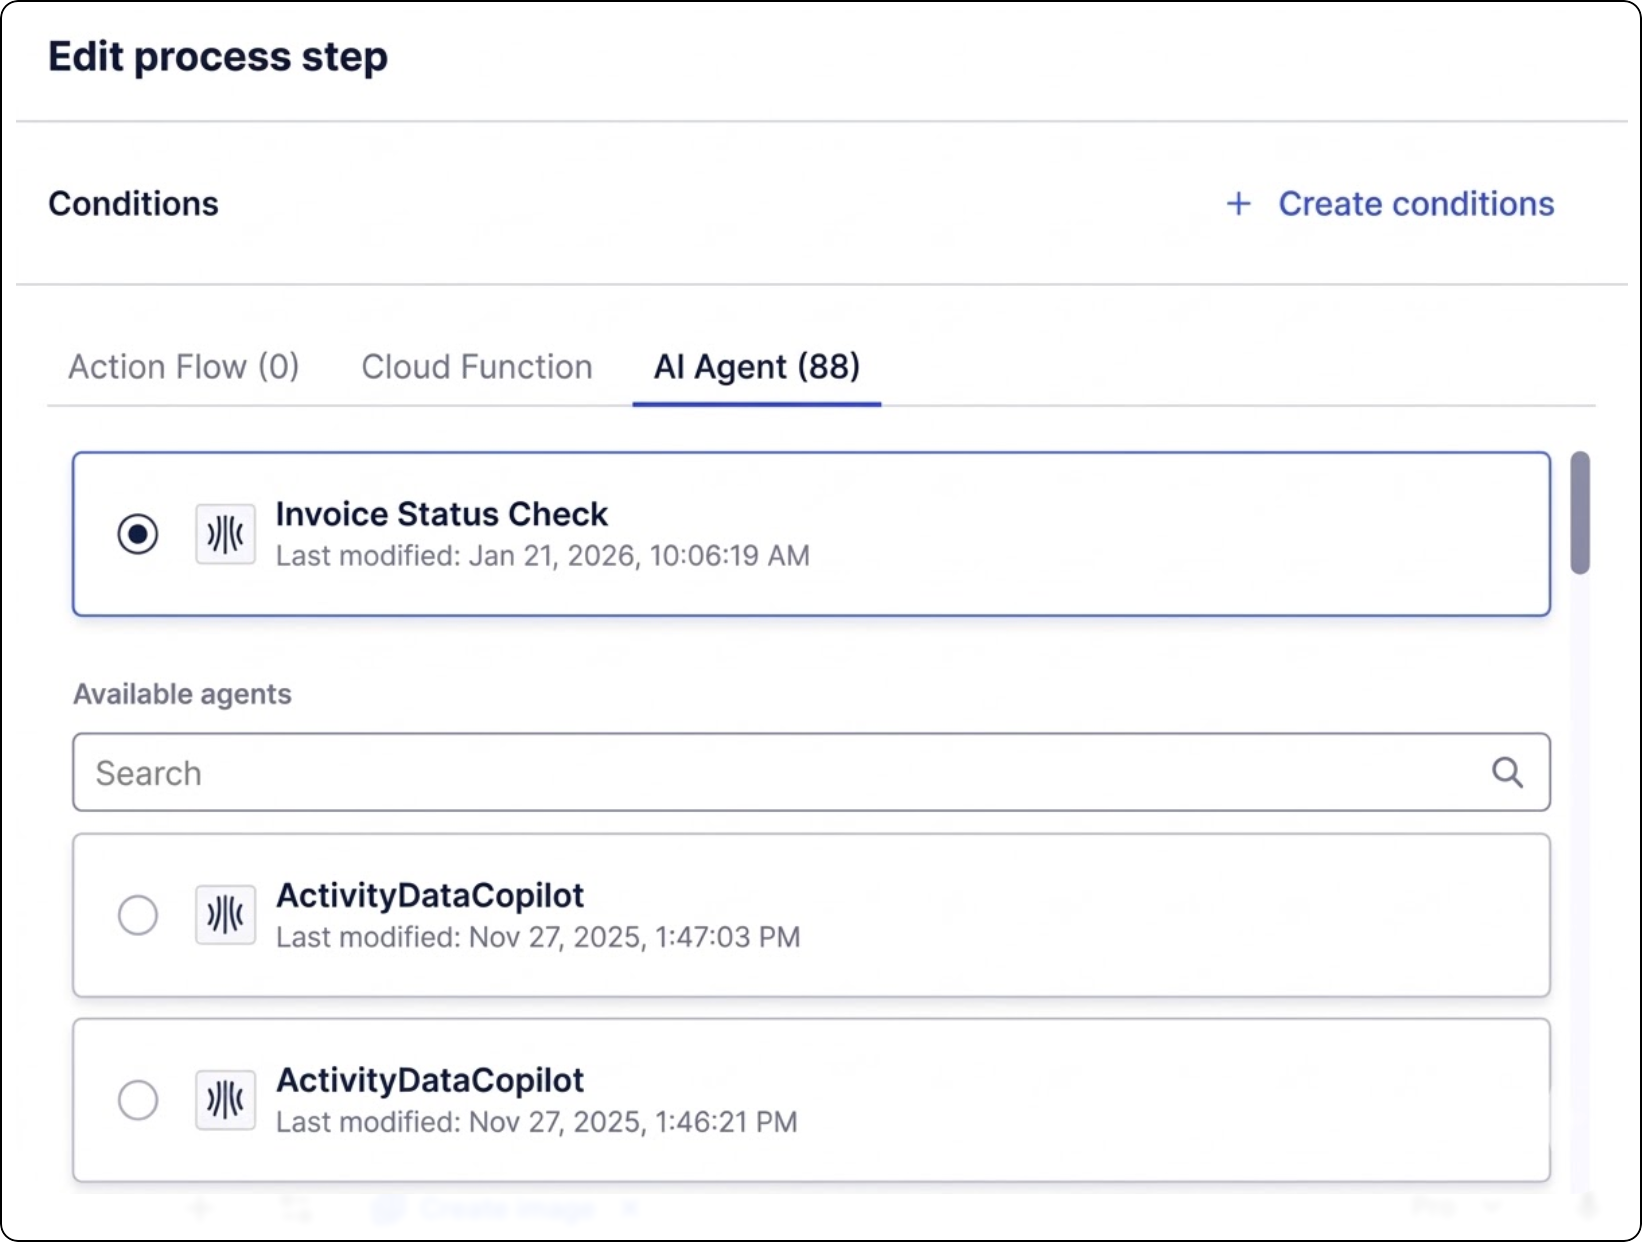
NEW STUDIO New MCP tools to interact with Orchestration Engine processes
The Agent Tools (MCP) asset is being upgraded with new tools that allow AI agents to interact with a process running in Orchestration Engine. These new tools are available in Studio and can be configured as part of your Process Copilots. These tools are configured for Process Copilots using the Tool Activation feature and can be either manually fixed by users or defined by the Agents at runtime.
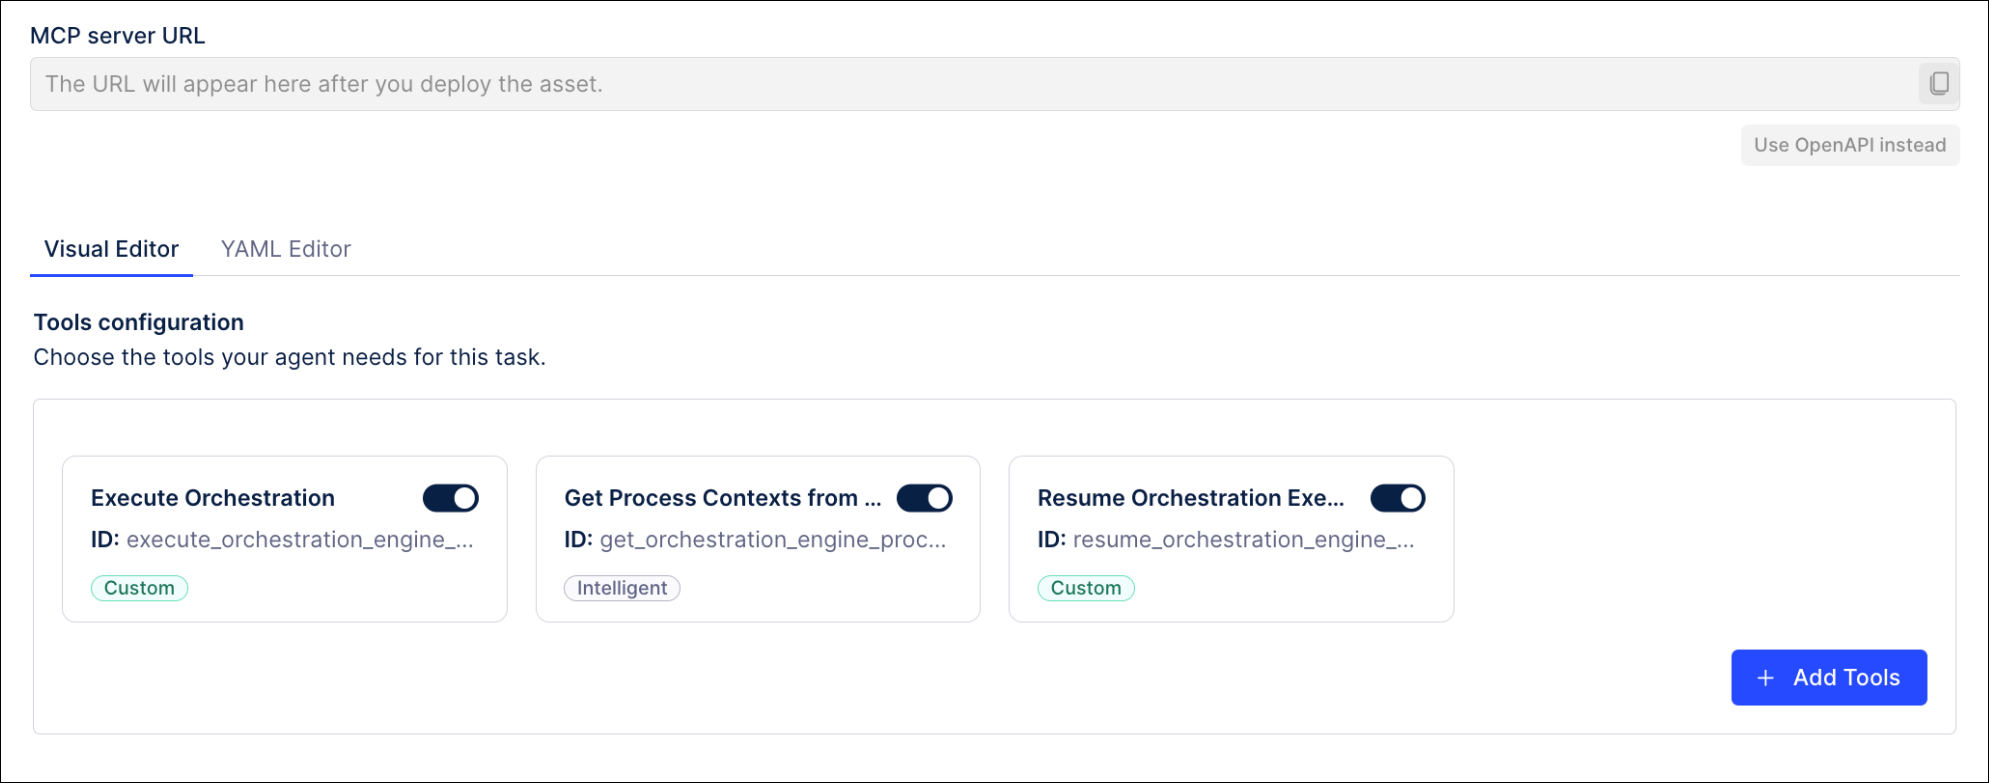 |
These new tools include:
execute_orchestration_engine - Sends a signal to trigger a new Orchestration Engine process instance.
get_orchestration_engine_process_contexts - Fetches process contexts for all Orchestration Engine instances. If no arguments are provided, will return all process contexts.
resume_orchestration_engine_execution - Resumes the execution of an Orchestration Engine process instance.
For more information, see Tool Activation.
April 8, 2026
NEW ADMIN AND SETTINGS Authorization Code Flow as new OAuth 2.0 grant type
We're adding Authorization Code as a new OAuth 2.0 grant type you can select when registering a new OAuth 2.0 clients in Celonis Platform. Authorization Code is a secure, server-side process for applications to obtain access tokens to authorized user data without exposing credentials.
For more information, see Registering your OAuth client in the Celonis Platform.
IMPROVED STUDIO Two-way binding added for enhanced variables in Views
We've changed how enhanced variables in View input dropdowns update to better reflect behavior expected by users.
Enhanced variables in View input components let you centrally create and manage information that is referenced and reused across Studio components and assets.
Previously, an input dropdown using enhanced variables always displayed the last value selected, even if the value of the enhanced variable had been changed elsewhere in the app. This could lead to mismatches between the enhanced variable value displayed in the input dropdown and the actual value of the enhanced variable.
With this change, the input dropdown will now always display the current enhanced variable value. If the current enhanced variable value is not available as an option in the input dropdown, an information message will display in both the app and in Studio, indicating that the enhanced variable value has been inherited from elsewhere.
For more information about enhanced variables, see Using enhanced variables in Studio components.
NEW STUDIO Visual mapping rules added for KPI card and Attribute list
We've extended visual mapping rules for colors and icons to the KPI card and Attribute list components in Views.
Previously, changing the colors used and creating and using visual icons wasn't supported for these components.
Extending this functionality to these components gives added flexibility around their use while providing a more consistent visual experience across Views.
In this example, a Primary Scale visual mapping has been selected for a KPI card and an up chevron icon added to the left of the KPI value.
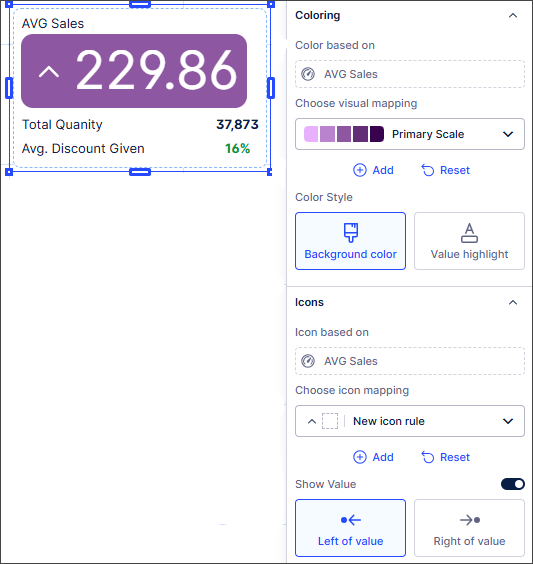
For more information, see Managing Studio and component color themes and Icon mapping.
NEW PROCESS ADHERENCE MANAGER New mining algorithm
Users can now choose between using the strict or balanced model miner when mining a model. Both miner types analyze the process graph that is created from an event log and try to match the patterns of events within the process graph. They use different approaches where patterns of events can’t be matched. The strict miner takes into account every single variant in a model. In contrast, the balanced miner optimizes models for fitness, which can help when mining a model with many variants.
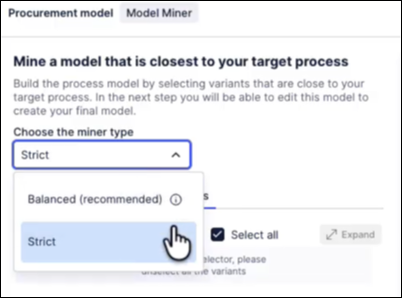
For more information, see Model miner types.
NEW PROCESS ADHERENCE MANAGER Adherence Explorer
The Adherence Explorer is the new analysis experience for PAM. It's a Studio View component that enables users to analyze deviations in the context of a broader analysis (such as building a dashboard with the conformance rate of a model). It seamlessly interacts with other View components, including charts, tables and Process Explorer.
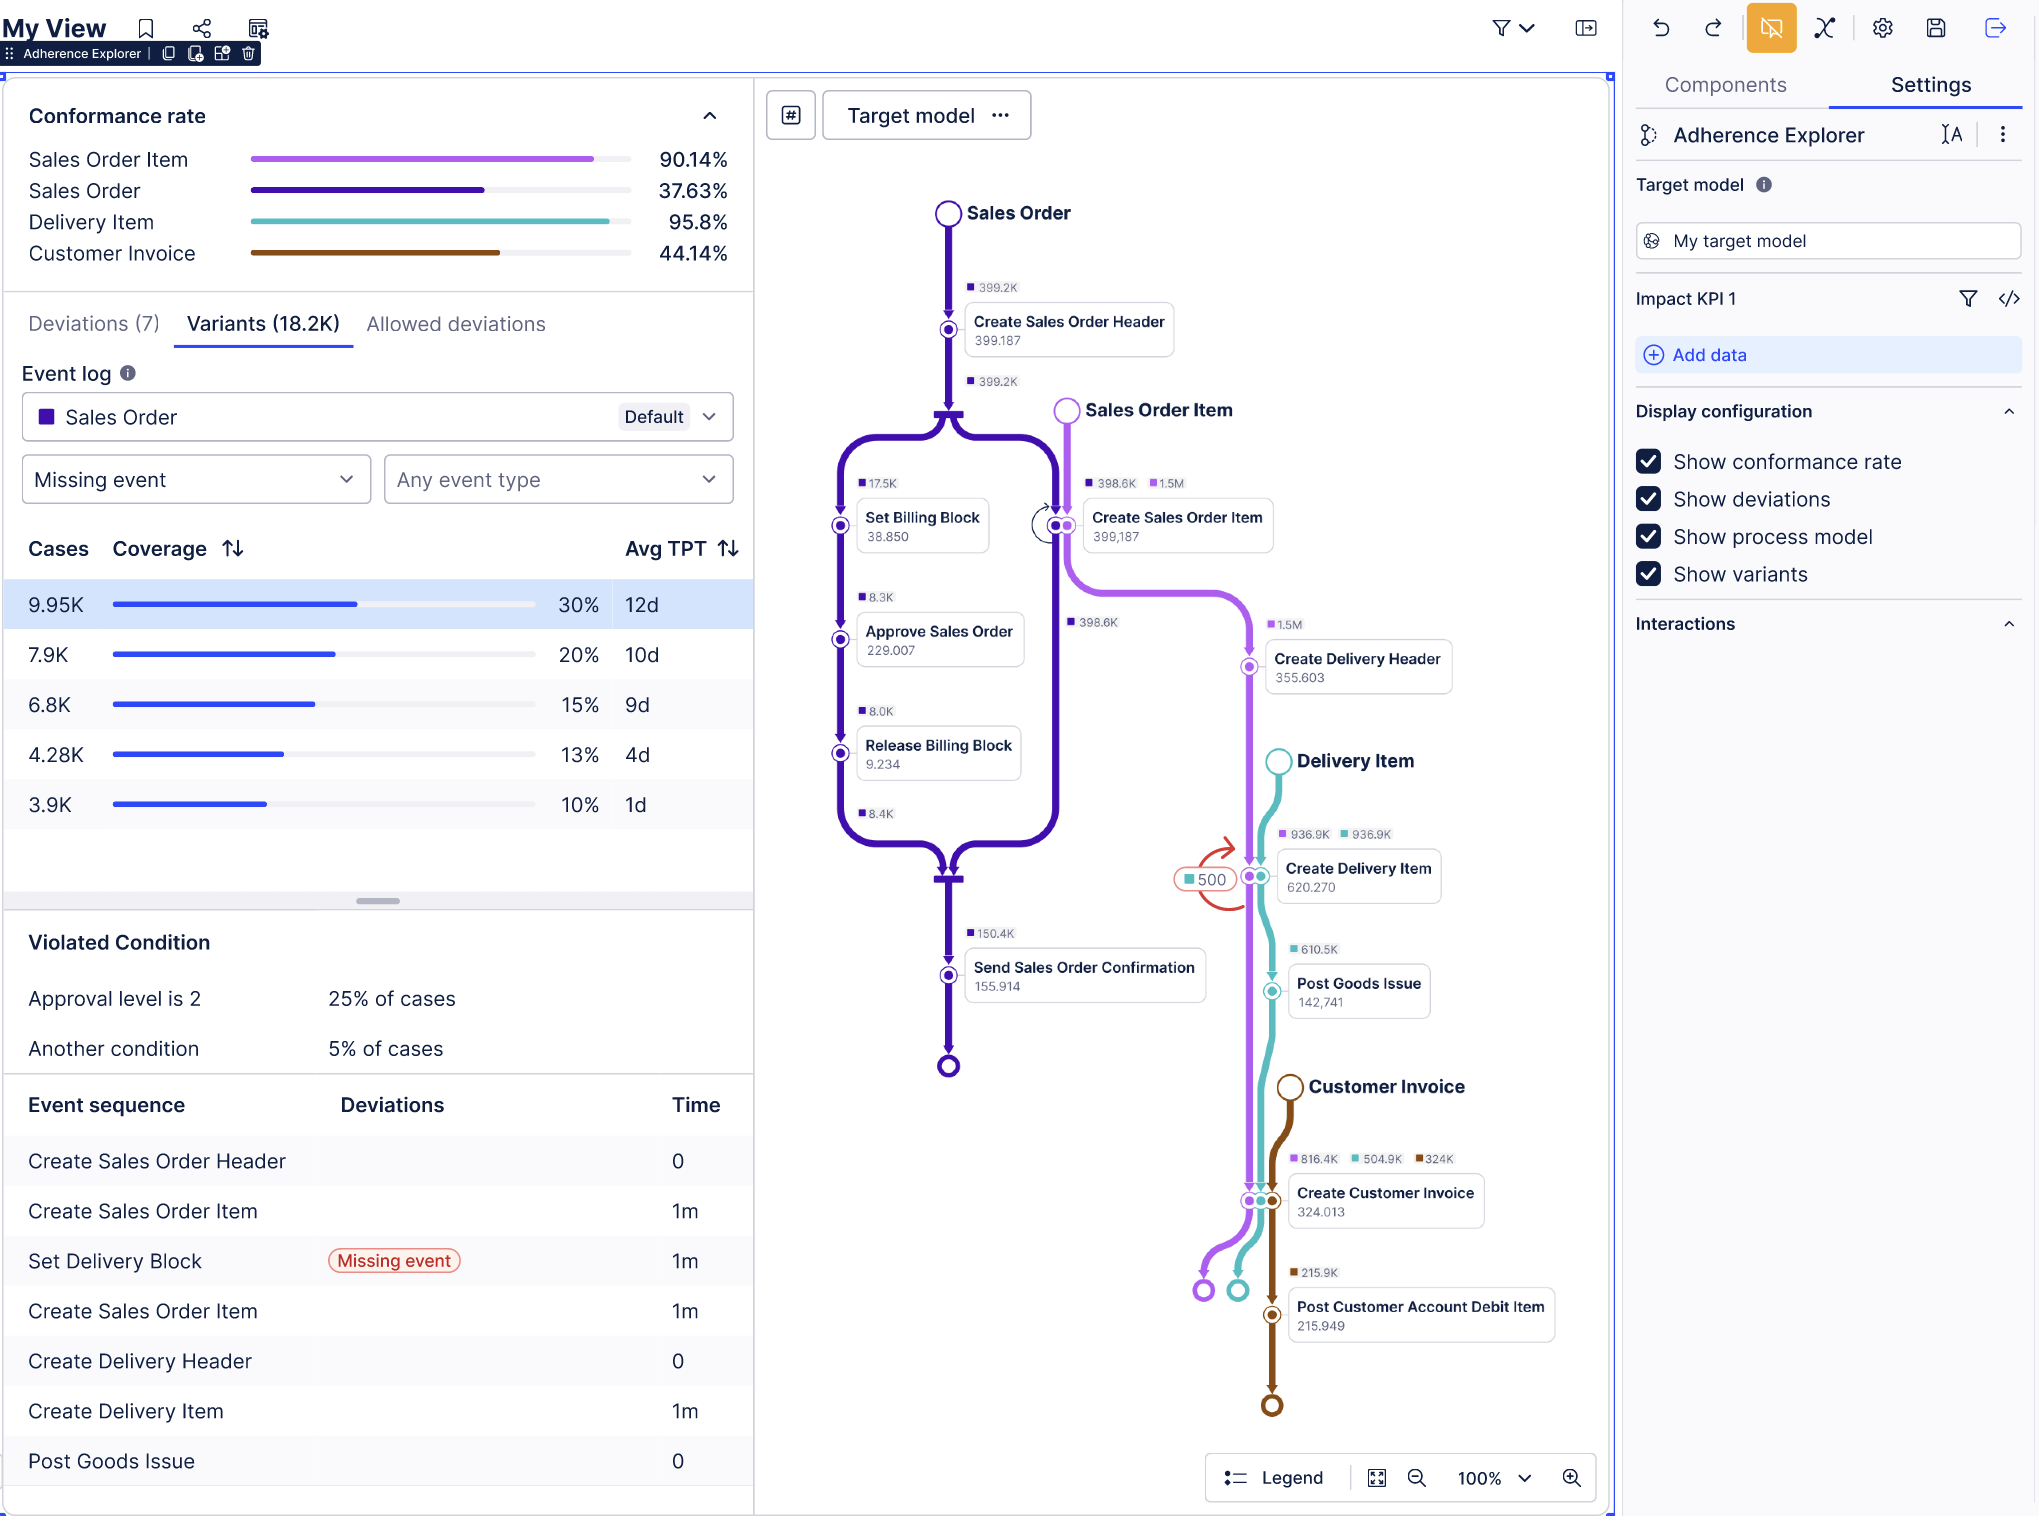 |
For more information, see Adherence Explorer.
PRIVATE PREVIEW STUDIO Control analyst access to Annotation Builder and Process Copilot assets
With this private preview release, admin users can now control which analysts can access and view and edit Annotation Builder and Process Copilot assets, adding an additional level of protection against unintended or negative consequences related to their use.
For more information, see Control analyst access to Annotation Builder assets and Control analyst access to Process Copilot assets.
And to learn more about our private and public preview releases, see Feature release types.
April 7, 2026
NEW DATA INTEGRATION Java requirement for on-prem JDBC
Starting April 2026, upgrading to the latest on-prem JDBC JAR will require Java 25. This is not a breaking change, as customers who do not update their extractor to the latest JDBC version will not be affected. We will update this page with the exact release version once it is finalized. No immediate action is required, but upgrades should be planned in advance.
To learn more about the on-prem JDBC extractor, see: JDBC Extractor.
March 31, 2026
IMPROVED PROCESS ADHERENCE MANAGER BPMN automatic repair
When importing a BPMN model into Process Adherence Manager, PAM now also detects if a model has multiple start events, multiple end events or multiple incoming/outgoing edges, and repairs these automatically.
For more information, see Automatic repair.
March 30, 2026
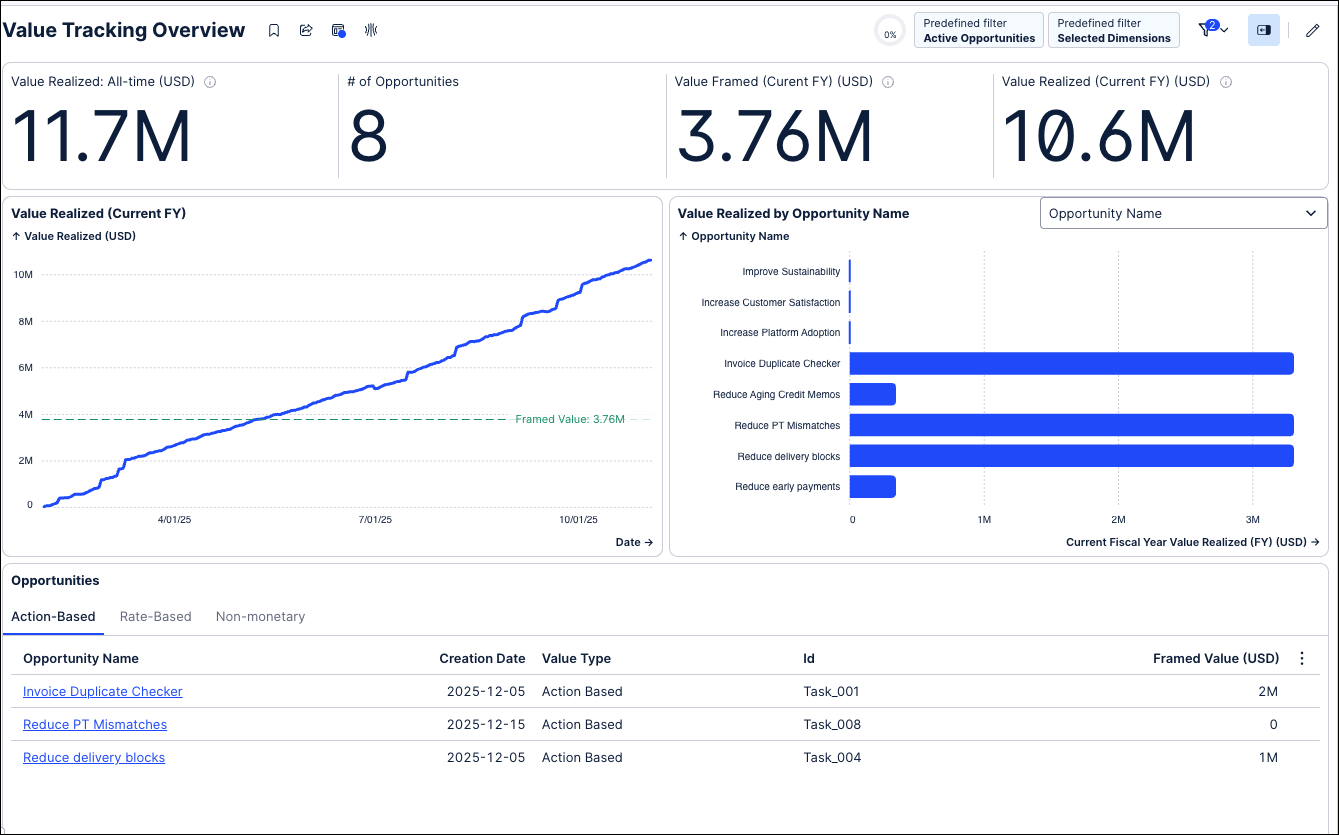
NEW TRANSFORMATION HUB Transformation Hub in Views app
The Transformation Hub in Views is a next-generation Business App designed to centralize how you track and report value across your Celonis initiatives. Built on a robust data model powered by KPI Snapshots, it offers a flexible environment to move from high-level summaries to granular details.
Key capabilities include:
Comprehensive Value Tracking: Monitor Action-based, Rate-based, and Non-monetary opportunities in a single location.
Realized Value Trends: Visualize how value is realized over time to demonstrate the continuous impact of your transformation efforts.
Multi-Dimensional Analysis: Break down value by specific dimensions such as country, region, plant, or material to identify where your initiatives are most successful.
For more information, see: Transformation Hub in Views.
 |
NEW STUDIO Create and track KPI Snapshots from your Knowledge Model
You can now create and track KPI Snapshots from your Knowledge Model. KPI Snapshots allow users to capture KPI values at scheduled intervals, creating a record of KPI performance at any given point in time. Instead of recalculating KPIs dynamically against live data, KPI Snapshots store the calculated KPI results as historical data, enabling reliable trend analysis over time.
For example, if teams update payment terms to improve results, historical KPIs might look better than they actually were. KPI Snapshots preserve the true historical view, letting you compare performance before and after changes and measure the impact of initiatives over time.
The benefits of using KPI Snapshots include:
Tracking historical performance: Keep a true record of KPI values, even if underlying data changes later.
Comparing before and after: Measure the impact of improvements or corrective actions.
Monitoring initiatives over time: See how KPIs evolve and track progress across teams.
Combining enterprise-wide views: Combine snapshots from multiple data pools and models to get a single, unified view.
Consistent reporting: Build dashboards and reports that reflect both historical and current performance in one place.
To learn more about creating and tracking KPI Snapshots, see: KPI Snapshots.
March 26, 2026
IMPROVED ADMIN AND SETTINGS Granular AI consumption limits and tracking
Managing a centralized pool of AI credits across multiple departments has historically been a challenge for Celonis administrators. Without the ability to subdivide global AI outputs, organizations faced risks of runaway consumption by a single use case, making internal capacity planning and budget forecasting difficult.
With this release, we have overhauled the AI Settings console to provide administrators with precise, proactive control over AI Output consumption. These enhancements ensure you can scale AI initiatives securely and predictably across your entire organization.
This release includes:
Accurate global thresholds: The AI Settings dashboard now accurately reflects your true, up-to-date AI Output limits at the company level (e.g., 10,241 / 100,000 AI outputs/year), allowing for reliable monitoring and budget planning.
Asset-level consumption limits: You can now subdivide your global AI credits by setting hard numerical caps on individual Studio assets. Admins can simply click into any AI asset (like a specific Annotation Builder model or Copilot) and apply a custom consumption limit.
Built-in safety mechanisms: By capping individual assets, you prevent end-users from accidentally exhausting the company’s entire AI quota on a single run. Once an asset hits its assigned limit, execution is paused and a warning is triggered, keeping your overall budget safe.
To manage your AI settings, see: AI Settings
PRIVATE PREVIEW STUDIO New temporary filters for Insight Explorer
Your filtering capabilities in Insight Explorer are getting an upgrade with temporary filters that allow you to perform a more in-depth analysis by applying a filter based on a specific insight. These temporary filters also allow for the use of your own custom attributes. Using these temporary filters, you can go deeper into a group of object instances within a particular insight and then generate additional insights based on that group. This provides the ability to drill down further on any of the insights generated by your Insight Explorer.
These filters can be applied by hovering on the filter for an insight and then clicking the filter icon on the right side. Clicking the Apply Filter button will create a filter based on the case cohort for this specific insight. This temporary filter can be removed at any time by clicking the filter icon again and clicking the Remove Filter button.
To learn more about Insight Explorer, see: Creating an Insight Explorer
And to read more about our private preview releases, see: Feature release types.
March 20, 2026
PRIVATE PREVIEW STUDIO Process inefficiency attributes for Insight Explorer
Insight Explorer is being upgraded with a new option for the process attributes setting that utilizes an AI agent to discover process inefficiencies that may impact the behavior of your KPIs. Identifying these inefficiencies will improve both the causality and quality of the insights being generated while also allowing for more complex process patterns in your insights, such as activity sequences or ping pong behaviors. Those process inefficiency attributes replace the basic process attributes.
To activate the process inefficiency attributes agent in your Insight Explorer, click the Advanced Settings button in the upper right corner. In the Advanced settings window, select the “Enhance with AI-detected inefficiencies” option under “Attribute recommendations” and then click the Update button.
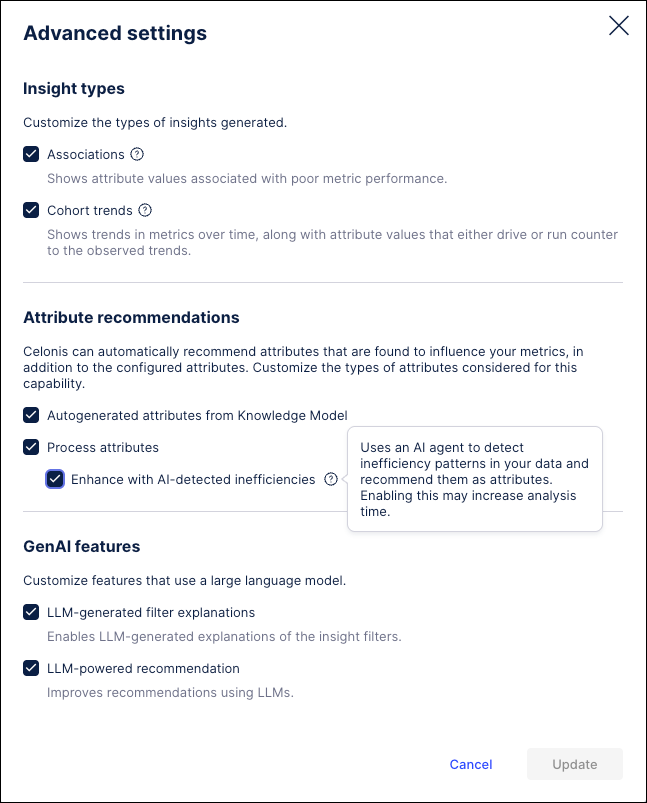 |
Once this Insight Explorer is configured and deployed, the process inefficiencies will be generated and displayed alongside your standard attribute recommendations.
For more information, see Configuring an Insight Explorer.
NEW STUDIO Structured Output from Process Copilots
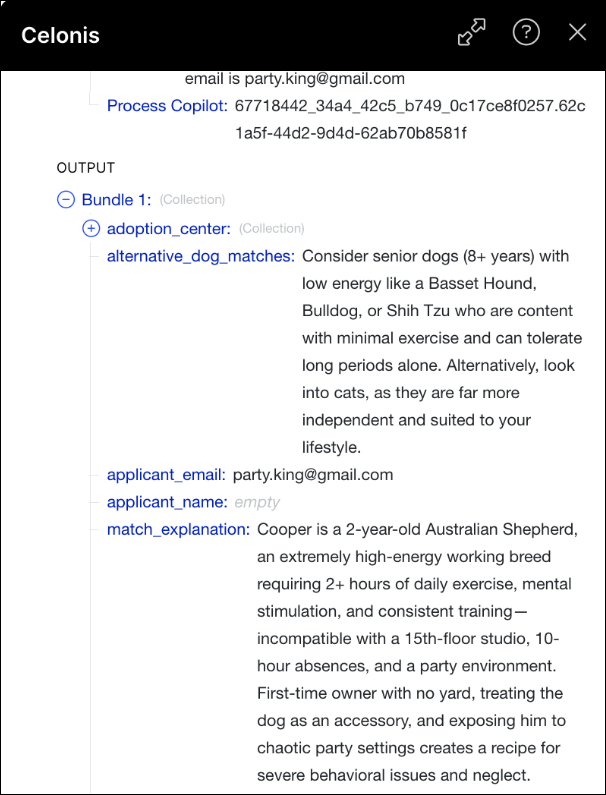
Process Copilots can now generate structured responses by utilizing a fixed JSON schema that can be customized in the AI Instructions of your Process Copilot configuration. Generating structured responses instead of the text strings provides a more predictable and repeatable output for your integrations with Action Flows, Orchestration Engine, or external APIs. Using this new configuration, you can develop a schema that maps specific fields directly to your Action Flow, Orchestration Engine, or external system without manual parsing. These structured responses prevent the need for manually coding JSON responses while also avoiding the potential processing errors caused by the string responses in your downstream analytics.
Note
All Process Copilot instances will respect the assigned schema regardless of whether the calls are made using ChatAPI, an Action Flow or Orchestration Engine.
 |
These new schemas are created on the AI Instructions section of your Process Copilot configuration by enabling the Structured data output toggle. You can then manually enter your schema or click the icon in the right corner to ask the AI assistant to generate the schema Schema based on your description. Once you have finished configuring this Process Copilot, you can test the schema and verify how your responses are displayed using the Integrations tab.
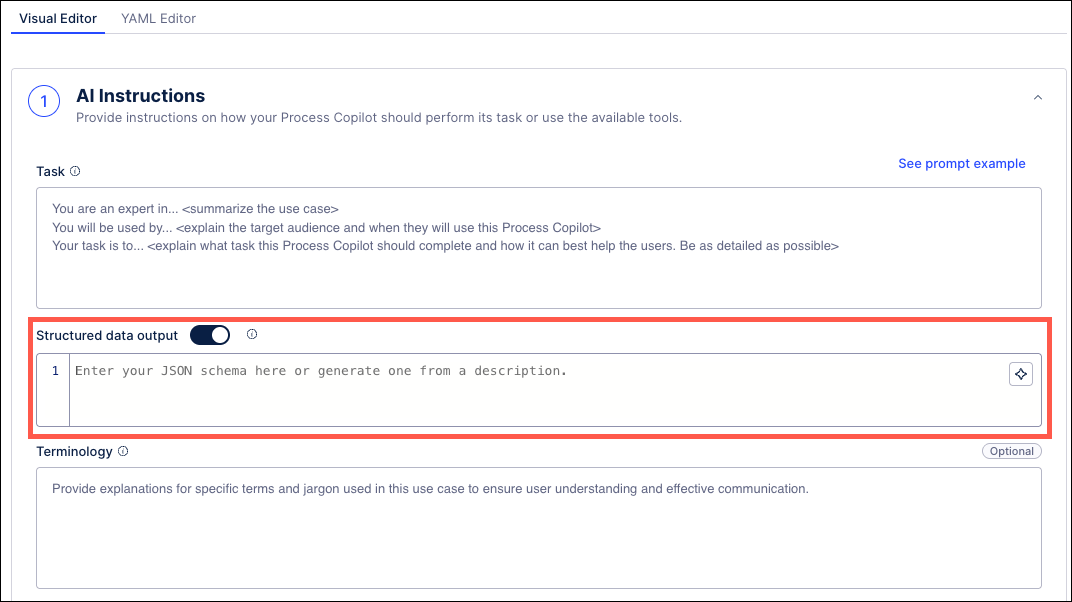 |
For more information, see AI Instructions.
NEW AUTOMATION Cloud functions in Orchestration Engine
You can now define and execute authenticated API calls to external web services directly within your Process Orchestration steps.
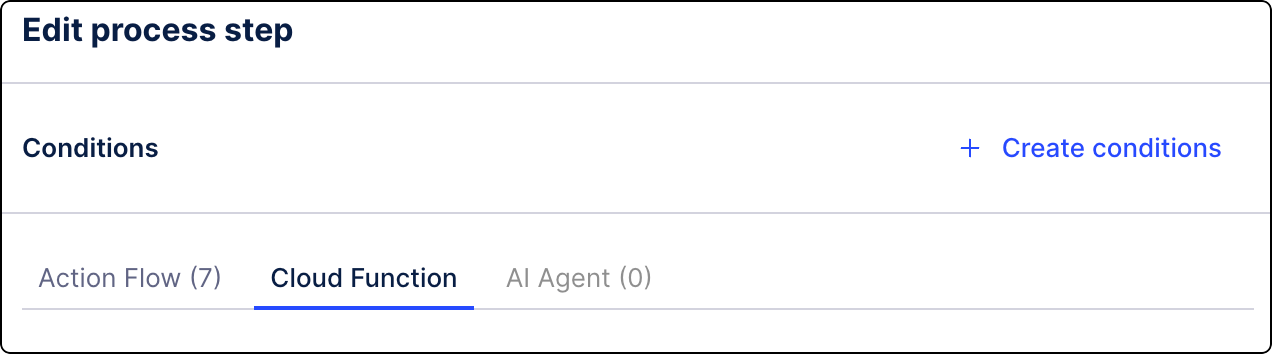
This new capability allows you to collect relevant data from external services and seamlessly inject it back into your orchestration workflow, making your automated processes more flexible and integrated with systems outside of Celonis.
For more information, see Adding cloud functions to Process Orchestration steps.
NEW AUTOMATION Process Copilot in Orchestration Engine steps
You can now use Process Copilot capabilities directly in your Process Orchestration steps, bringing conversation AI into your automated end-to-end workflows.
This integration allows you to use Process Copilot's ability to converse with your Celonis data within any orchestration step. You can analyze data by asking natural language questions, build graphs, search for insights, or view process flows, making your automated business processes more dynamic and data-driven.
For more information, see Adding Process Copilot to Process Orchestration steps.
IMPROVED AUTOMATION Updates to the Send emails action
We have enhanced the Send Email action in Views. In addition to using your personal email address, you can now send messages using the Celonis service address (noreply@celonismail.com).
For more information, see Adding Actions to Studio components.
IMPROVED STUDIO View edit mode performance improvements
We've made some performance improvements in Views. The content in your View will no longer reload when you enter and exit View edit mode, giving you a more seamless user experience.
Note
As we'll be rolling this improvement out over the next few weeks to different groups of users, you may not experience this improvement immediately.
March 19, 2026
NEW DATA INTEGRATION Filtering methods added for Extractor Builder endpoints
In the Extractor Builder, you can now use the new Filtering Method configuration to define specific filter rules for endpoints, similar to the existing pagination setup. By selecting specific methods based on your source API, you now have more granular control over your data queries, such as using individual query parameters for standard requests or the request body for POST endpoints.
Note
To ensure continuity, existing endpoints have been automatically assigned a Legacy Filtering setting, allowing current extractions to remain functional without modification. All new endpoints will default to No Filtering; however, we recommend configuring an explicit filtering method for each endpoint to allow for efficient delta loads.
For more information on configuring filtering methods for endpoints, see Configuring endpoints.
PUBLIC PREVIEW STUDIO Knowledge Model asset editor usability improvements
Important
Only eligible customers can access this functionality while it is in Public Preview. If you're an eligible customer and don't want to use this functionality during this Public Preview period, please create a Support ticket at Celonis Support.
With this Public Preview release, we've made some changes to how you interact with Knowledge Models, making them easier and more intuitive to use.
We’ve updated the Knowledge Model asset editor. By replacing the current left-hand vertical navigation with a new horizontal tabbed navigation, we've improved screen real estate use.
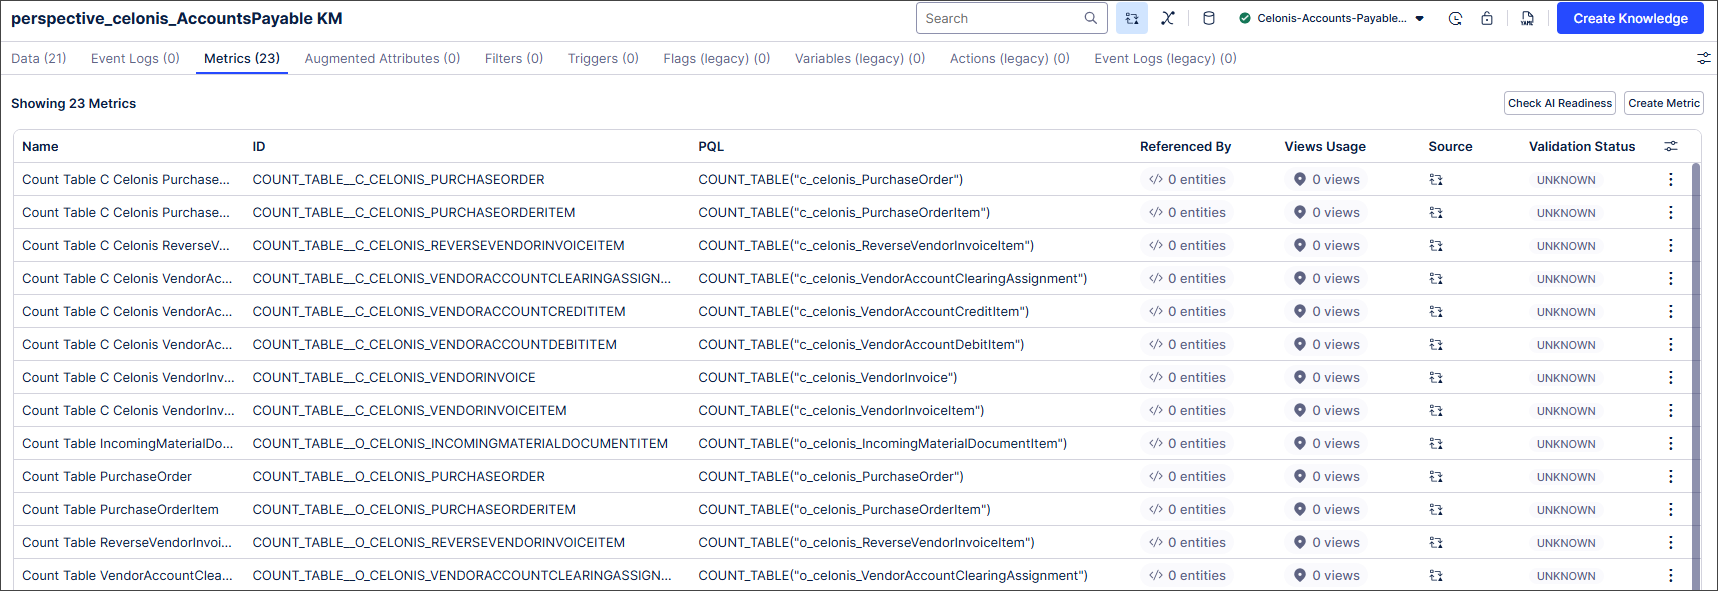 |
Within the Knowledge Model asset editor, you can also now show/hide table columns including short display name, internal note, unit and format. We've also introduced advanced filtering at column level:
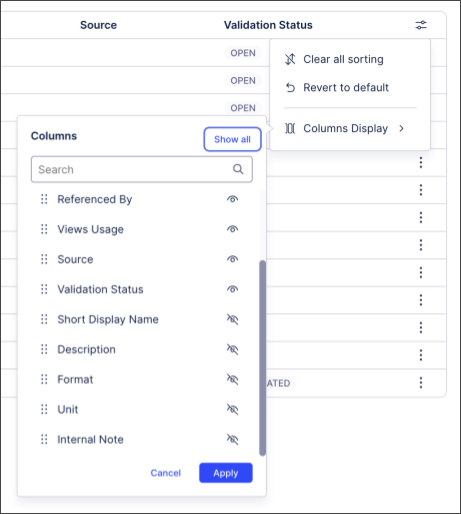 |
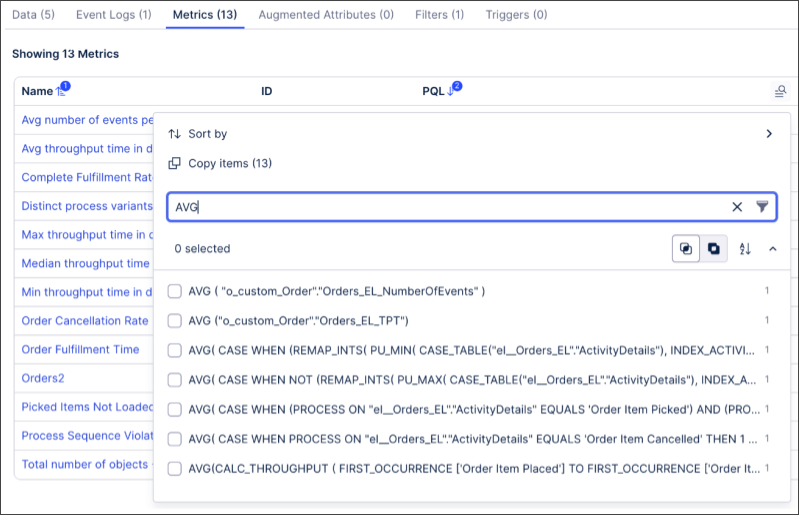 |
You can also now access the new PQL editor from directly within a Knowledge Model using the three dot  button:
For more information about working with Knowledge Models, see Knowledge Models.
And for more information about our public preview releases, see Feature release types.
March 17, 2026
IMPROVED STUDIO New event count metrics in the Multi-Object Process Explorer
The metrics available for the Multi-Object Process Explorer are being expanded with the new Event Count tab which allows you to see how often an event occurs for a specific object. This new tab is available by clicking on any event in your Process Explorer graph to view the event node details.
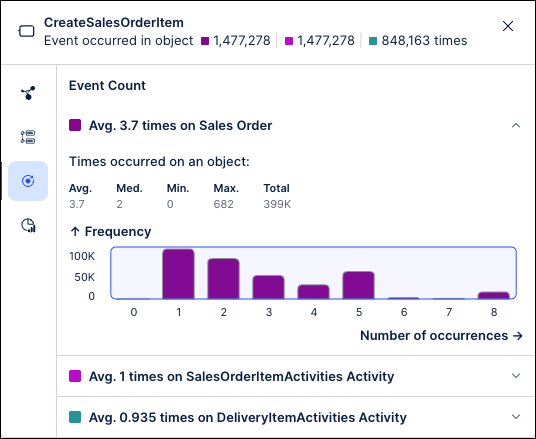
This tab includes an expandable section for each object and includes the count metrics for this event, including the average number of times it occurs, the maximum number of times it occurred, and the total number of occurrences for this object. Each section also includes a graph showing the frequency with which every number of occurrences happens for this object, such as how often this event occurred four times or how often it occurred twice. This information is similar to the metrics shown on the “Event count” tab in the Event Explorer metrics.
Along with this change, the average times per object metric is being removed from the Occurrence tab in the node details.
For more information, see Event node details.
NEW STUDIO Updated testing features for Process Copilots
Process Copilots are being updated to include a new option that allows you to switch between sources (External API and Celonis Asset) in order to test both the internal and external integrations of your Process Copilots from the chat interface. This update is designed to give you full control over how you test and validate your Process Copilots during the development process and allows you to simulate different execution surfaces in order to ensure that your configuration delivers accurate reasoning.
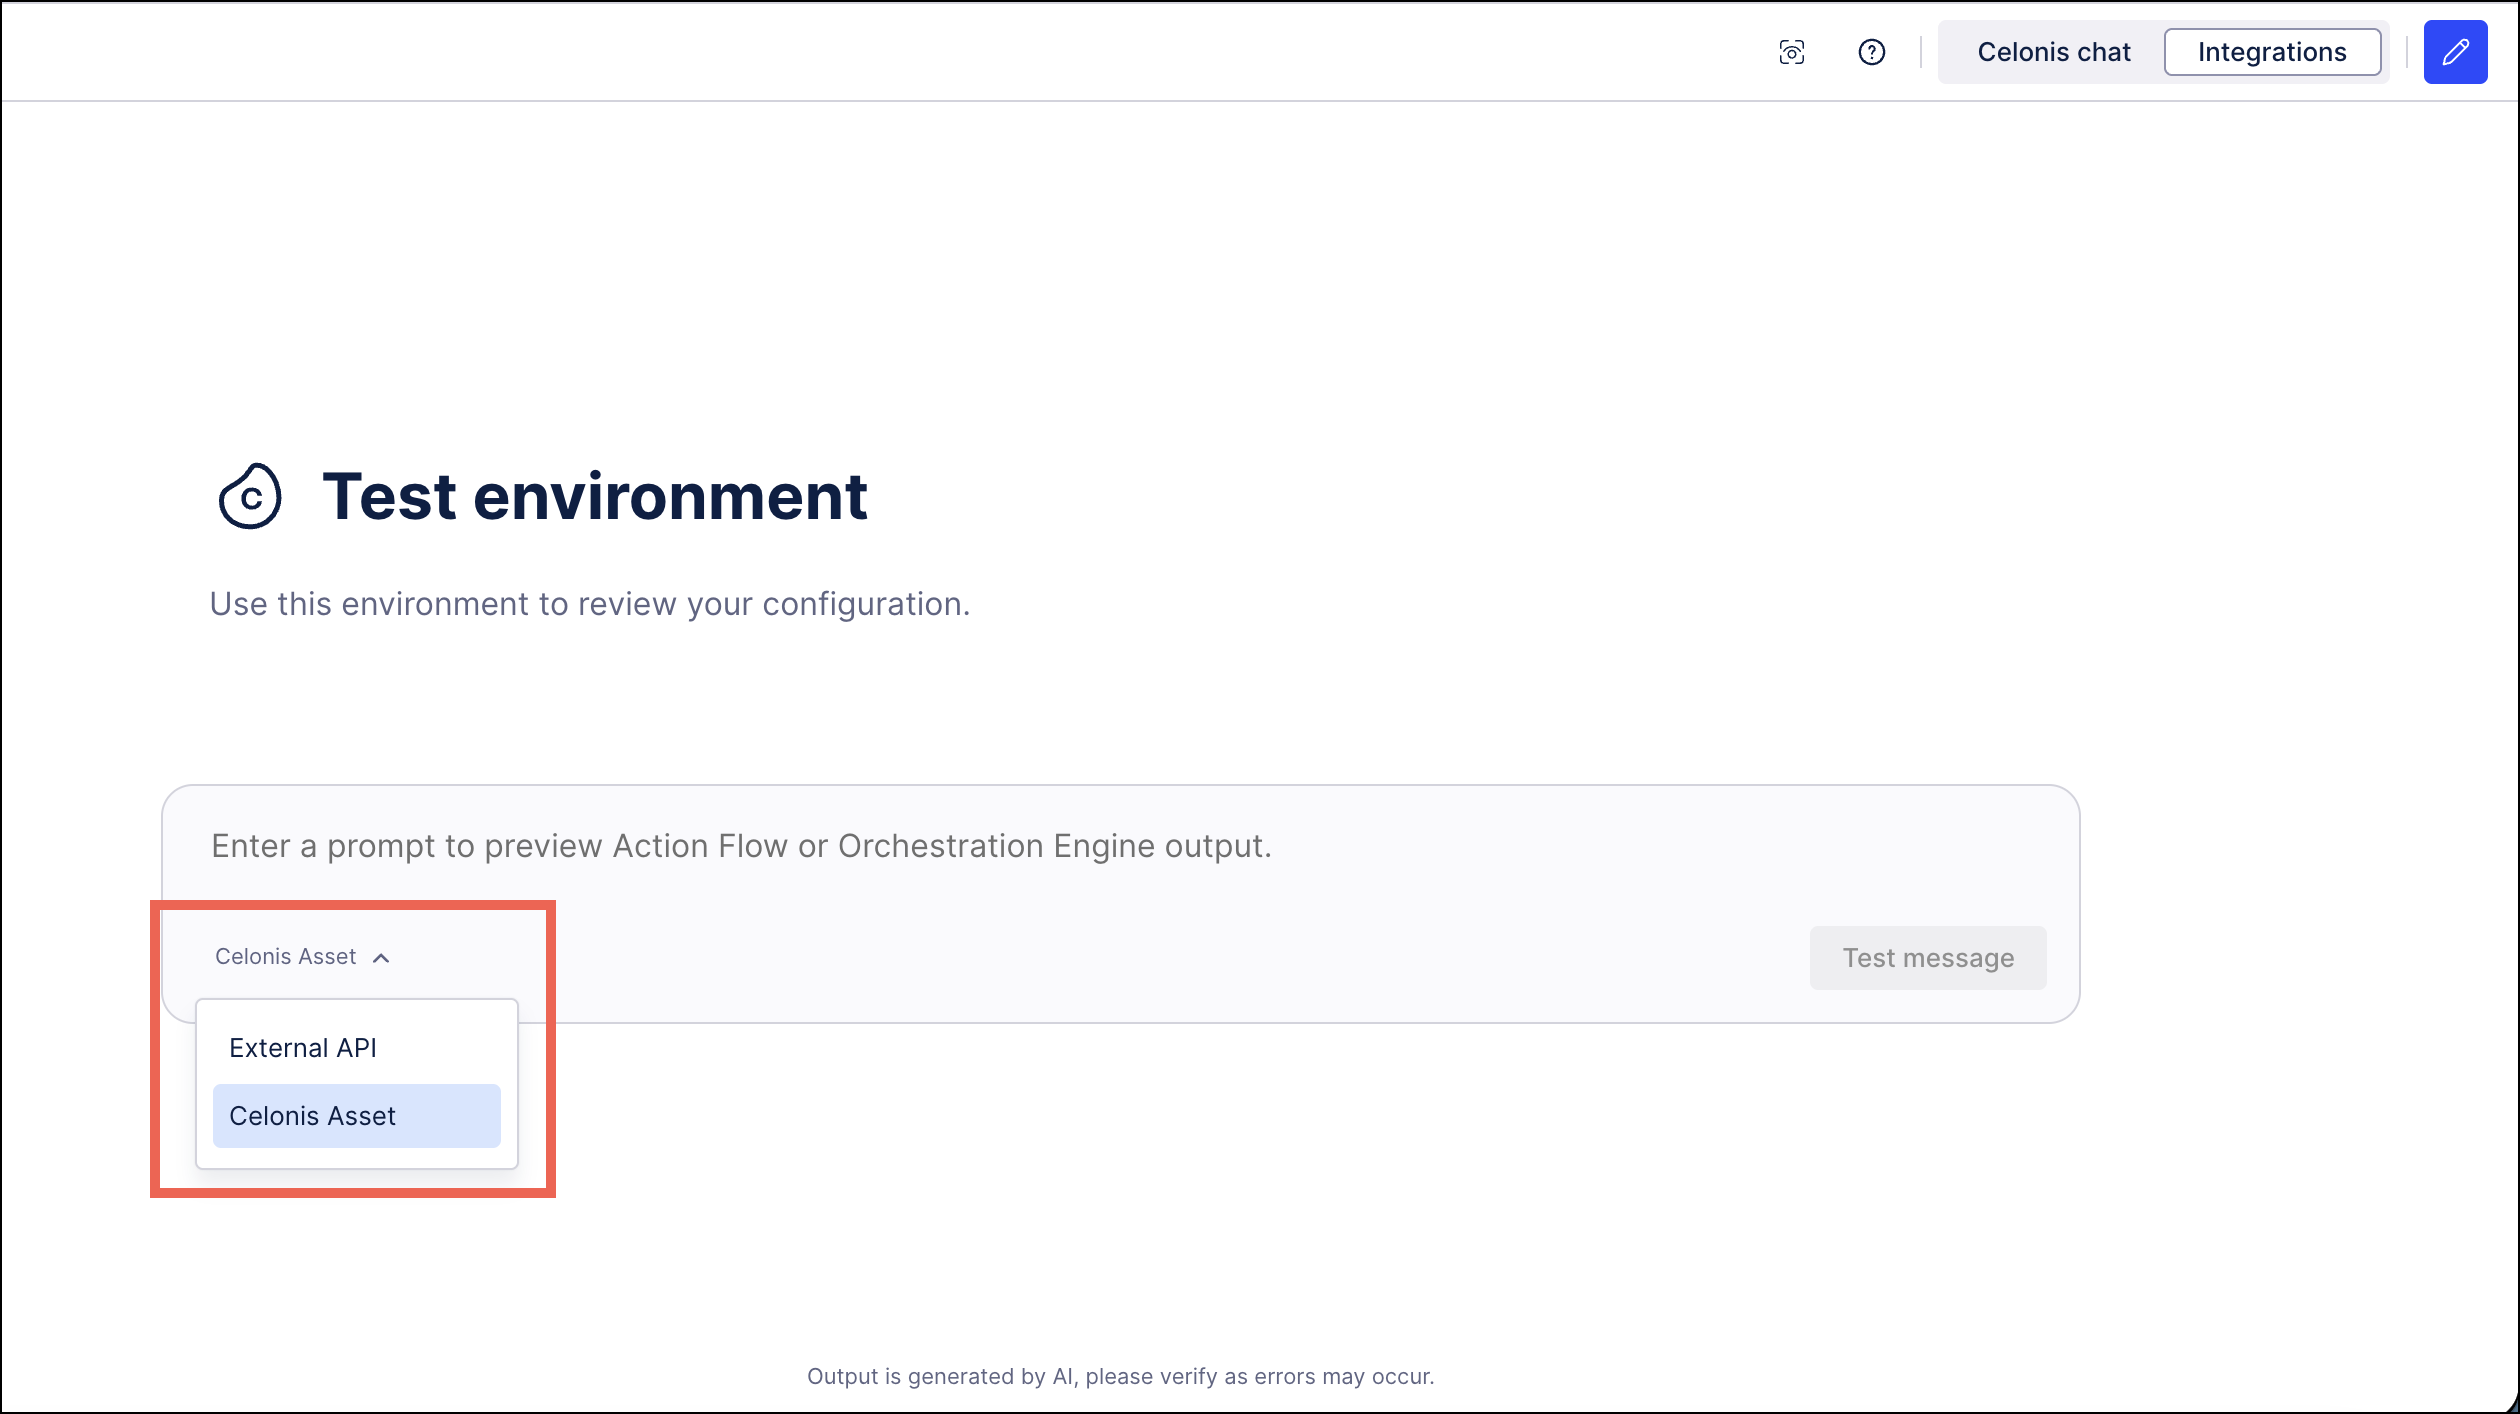 |
On the Integrations panel, you can select to use the External API option to test conversations triggered from third-party applications such as Microsoft Teams and then switch to Celonis Assets to verify task executions triggered from your Action Flows or Orchestration Engine. The results of the tests from either integration will be logged and can be viewed from the Monitoring page.
March 14, 2026
REMOVED STUDIO Status badge removed for packages and assets
As part our recent updates to versioning and deploying packages, we added a badge to the user interface which displayed the version and deployment status of packages and other Studio assets. We've now discovered an issue with this status badge so have removed it, meaning the status badge will no longer display.
For more information about versioning and deploying assets, see Versioning and deploying packages.
March 12, 2026
IMPROVED OBJECTS AND EVENTS Objects and Events filter added to the event log builder
We've added an object and event filters in the event log builder. These filters allow you to select specific events or objects to include or exclude in your event log. By reducing the amount of data materialized in the log, this results in faster performance and more efficient analysis of process mining data.
This improvement is especially useful for large datasets, where unnecessary events or objects can slow down analysis. You now have more control over the granularity of the data included in your logs, enabling cleaner and more focused insights.
To learn more about creating event logs in the Knowledge Model, see: Event logs (object-centric).
March 10, 2026
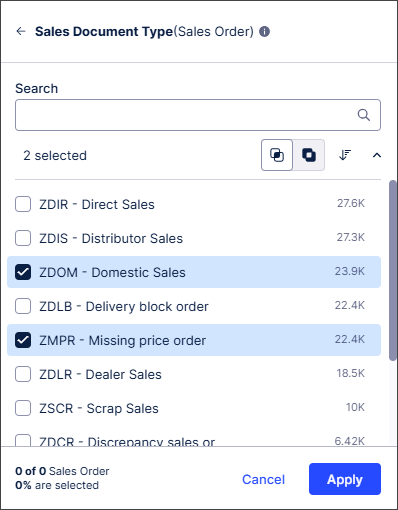
IMPROVED STUDIO Apply and cancel actions aligned across all filters
We've made some changes to improve the consistency of filters across Views in the Celonis Platform.
Previously, some Views filters were applied and saved automatically as soon as values were selected, with the filtered output updated each time an individual value was selected or removed. For other Views filters, the filter was applied and saved only when confirmed via an Apply button.
We've now aligned all Views filters so filters are only applied and saved when the Apply button is selected. A Cancel button also allows the filter selection to be easily discarded.
For more information about Studio filters, see Filtering Studio Views.
IMPROVED MACHINE LEARNING PyCelonis MLWB write directly to the data model with augmented attributes
We have expanded the PyCelonis DataModel with a dedicated Augmentation API. You can now programmatically manage the entire lifecycle of an augmented attribute directly from your Jupyter notebooks:
create_augmentation_table(): Provision a new augmented table on the fly by declaring column names, data types, and the foreign key join definition mapping it to your base Data Model table.upsert(df): Easily update existing records or insert new ones (Upsert) based on a primary key—perfect for updating live machine learning predictions as new data arrives.remove(df, key): Programmatically delete specific rows from your augmentation table.augmentation_table.delete():Programmatically delete your augmentation table entirely.
Previously, injecting machine learning predictions or custom Python calculations back into the data model required routing the data through a complete data integration pipeline and triggering a data load. With this release, you can now close the loop, writing results straight from a Pandas DataFrame in MLWB into your operational data model in real-time.
Ensure your PyCelonis library is updated to the latest version to access the new Augmentation API. For detailed code examples and syntax, please refer to the PyCelonis documentation and the Augmented Attributes user guide.
March 5, 2026
NEW DATA INTEGRATION Celonis Compute Units tracking added to data pool overview
You can now track your team's Celonis Compute Units (CCUs) usage from your data pool overview screen. Celonis Compute Units are a standardized metric used to quantify the compute capacity required on the Celonis Platform when using the new ETL Engine.
When monitoring and tracking your CCU usage, the following details apply:
Monthly reset: Your allocation resets automatically at the start of each billing month.
No rollover: Unused units expire at the end of each month and do not carry over.
If the monthly CCU entitlement is exceeded: All data processing activities, including data extractions, transformations, and model loads, execute on a best-effort basis. This means ETL tasks may experience reduced priority and slower completion times until the automatic monthly CCU reset.
To learn how to track your CCU usage, see: Tracking CCU usage.
And to learn more about these metrics, see our terms and conditions: Celonis - Terms and Conditions - Services.
PUBLIC PREVIEW STUDIO Object-centric Instance Explorer component added to Studio Views
With this public preview release, you can now configure an Instance Explorer component for your object-centric data in your Studio Views. The component lets you explore individual object instances, like Orders, Invoices, or Flights, and their events within the digital twin. You can see each object’s lifecycle and relationships without creating custom queries or tables.
The key features include:
Search by ID: Inspect objects by their unique identifiers and view their full lifecycle and relationships.
Investigate case behavior: See object relationships and event sequences to understand current states.
Verify data representation: Check how source system data is represented and share with stakeholders.
The Instance Explorer component can be viewed using a graph or list view, with an example of the graph view displayed here:
To learn more about configuring and using the Instance Explorer component, see: Instance Explorer.
And to learn more about your public and private product releases, see: Feature release types.
PRIVATE PREVIEW PLATFORM New Celonis Assistant available in Private Preview
The new Celonis Assistant is an AI-enabled support assistant that guides you in the use of your Celonis products in real-time. The Celonis Assistant can offer best practices, suggest products, provide assistance with troubleshooting or guide you to build custom solutions on the Celonis Platform.
The Celonis Assistant can be accessed from the main menu on the Celonis Platform and opens a chat window allowing you to ask questions. Using this chat functionality, the Celonis Assistant can offer help with product specifications, best practices, product updates, troubleshooting, use cases, success stories, suggested solutions and more. As you explore the various processes available for you to implement, the Celonis Assistant can provide suggestions about KPIs to track or specific use cases to analyze, and share implementation success stories.
To use the Celonis Assistant, you will need to enable AI Settings and Azure OpenAI models for your team. For more information, see AI Settings.
And to learn more about our Private Preview releases, see: Feature release types.
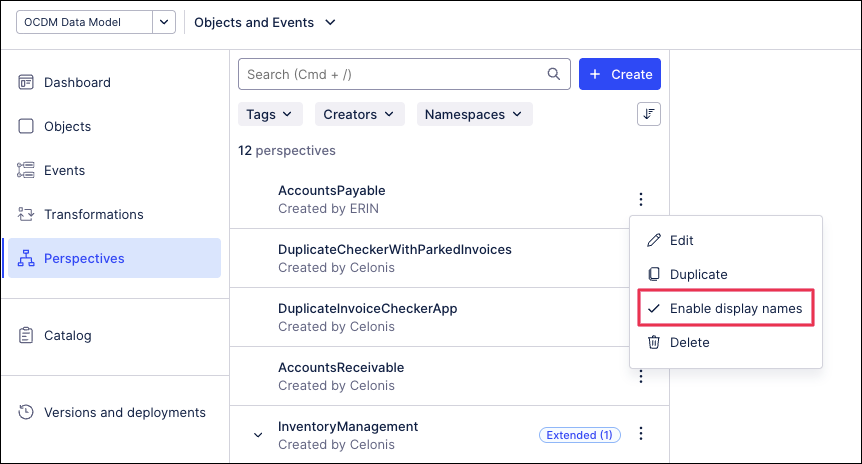
PUBLIC PREVIEW OBJECTS AND EVENTS Specify alias names for objects and events perspectives
With this public preview release, you can now assign custom alias names to objects and events within your perspectives. Using aliases allows you to simplify the naming conventions and shorten the more complicated technical table names when creating PQL statements. Once an alias has been assigned, you can use both the original name and the alias when creating your queries.
To enable the use of aliases when viewing your perspectives, click Options - Enable display names:
 |
To learn more about creating and using perspectives in Objects and Events, see: Perspectives.
And to learn more about our public preview releases, see: Private/Public Preview features.
March 3, 2026
IMPROVED STUDIO Enhanced reasoning and power capabilities for Process Copilots
The architecture of your Process Copilots has been upgraded to unlock deeper thinking capabilities and provide more reliable data handling. This overhaul will remove technical bottlenecks and allow your Process Copilots to deliver more accurate responses and process even more complex workflows with ease.
Expanded Thinking: A 50k+ token context window and doubled output limits allow for longer and more coherent analysis.
Complex Tasks: Process Copilots can now support up to 25 tool calls in a single interaction which allows you to process more sophisticated, multi-step workflows.
Visual Data Awareness: Your Process Copilots now "see" the charts and KPIs they generate and provide intelligent insights on those responses instead of static captions.
March 2, 2026
NEW STUDIO Dimension switching in charts
Dimension switching enables faster, more flexible self-service analysis, allowing users to explore multiple data perspectives within a single chart for quicker insights and a better experience.
Users can now dynamically adjust the data in bar, column, line, and area charts by enabling dimension switching.
Previously, users couldn't easily switch between visualizing data on a weekly and a monthly basis.
With dimension switching, users can now change the data perspective displayed using a simple dropdown in the chart.
In this example, the user can select whether to display the Sum data by Ship Mode, State or City.
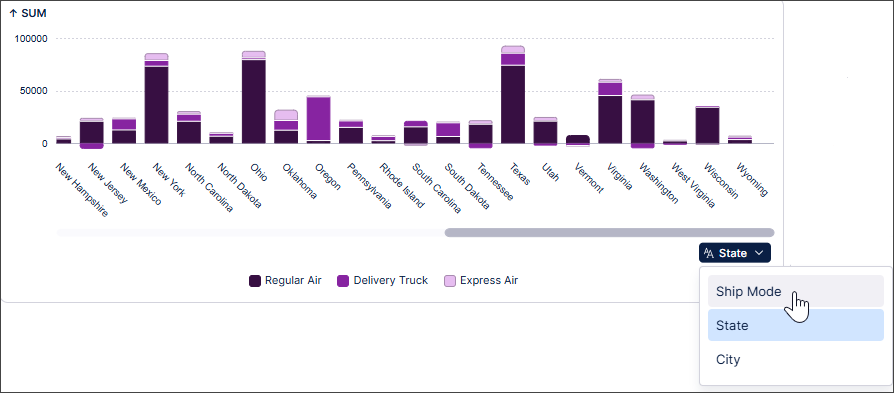 |
To find out more, see Switching dimensions in charts.
NEW STUDIO Full Analysis to Studio View migration available
You can now migrate your full Analysis assets and settings to Studio Views with the migration wizard, enabling you to create dashboards and reports using our enhanced View editing experience.
While Celonis continues to maintain Analysis (by fixing bugs and ensuring performance remains strong), no further feature development will take place. We therefore recommend you migrate your Analysis assets to Studio Views.
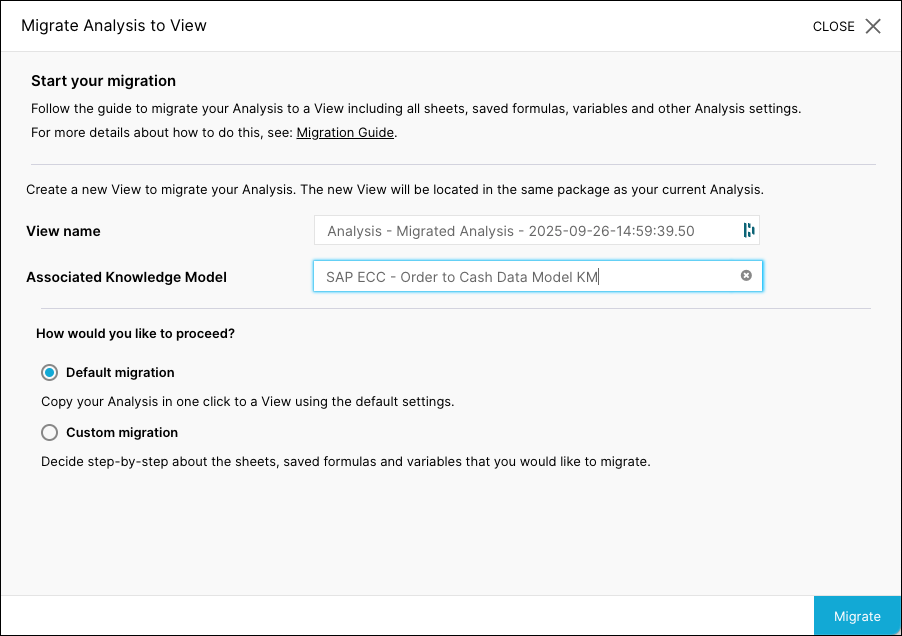 |
For more information, see Full analysis to Views migration.
IMPROVED PROCESS ADHERENCE MANAGER BPMN automatic repair
When importing a BPMN model into Process Adherence Manager, PAM now also detects if a model has multiple start events, multiple end events or multiple incoming/outgoing edges, and repairs these automatically.
For more information, see Automatic repair.
IMPROVED STUDIO Migrating translations from an Analysis to a View
You can now import translations from a Data Model to a Studio package.
Translations in an Analysis use Data Model name mappings. In Views, translations are saved in the package settings. To migrate translations, the name mappings can now be imported to the package settings.
When migrating an Analysis to a View, the translation syntax is automatically updated during the migration and uses the translation keys from the package, with no changes required in the Analysis or View. Users can then select their preferred language from the View Translations menu.
For more information about migrating Analyses, see Migrating Analysis to Views and for information specific to this functionality, see Migrating translations from an Analysis to a View.
February 27, 2026
IMPROVED STUDIO New object-centric performance metrics in the Multi-Object Process Explorer
The new Synchronization tab introduces object-centric performance metrics in the Multi-Object Process Explorer component, which allow you to view the range of event lead times, execution times, and synchronization times for all objects in a process. These new metrics include:
Event Lead Time: The total duration from when the earliest input object becomes available to the completion of that specific event. Event Lead Time can be thought of as the total amount of time needed for the preparation and execution of all steps in the process.
Synchronization (Sync) Time: The time between when the first and last input objects arrive at a shared event. Sync Time captures the delay caused by waiting for all involved objects to be ready.
Execution Time: Amount of time from when all input objects are available to when execution is complete. During this period, all objects are ready and nothing is blocked on the data side, but no action occurs.
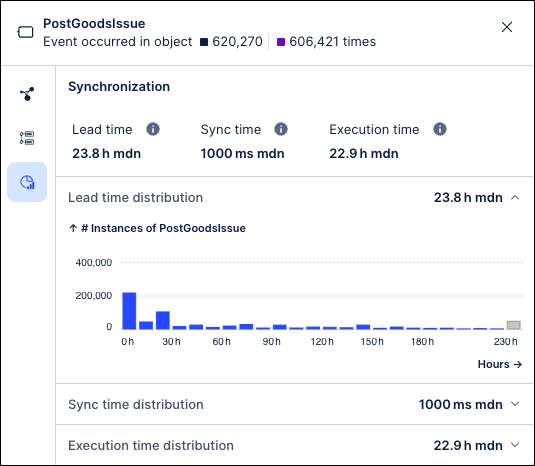
These metrics are computed for all shared events in the process and can be viewed on the Synchronization tab by clicking the event node in the process graph. The Synchronization tab shows the range of times for each metric and how frequently each time value occurred across the events in this process. In addition, these metrics also provide the average, median and trimmed median values.
These metrics are available out-of-the-box and can help to identify critical bottlenecks in your processes such as:
How long does it take events with multiple objects/shared events/events requiring multiple inputs to complete? (Event Lead Time)
How much time is spent waiting for all inputs to arrive? (Sync Time)
How long does a process idle once all inputs are ready? (Execution Time)
For more information, see Event node details.
February 26, 2026
IMPROVED STUDIO Reusing View modules across packages
You can now use View modules across different Studio packages.
Previously, you could only reuse modules within your own package. This new functionality gives increased flexibility by allowing View module reuse across packages. Published changes to the reused View Module can be updated as required.
For more information, see Reusing View modules across packages.
February 25, 2026
IMPROVED OBJECTS AND EVENTS Creating events from tables
Data engineers and analysts can now create event types directly from raw source data. This enhancement streamlines event modeling by automatically generating the SQL transformations that map event types and relationships to the data. It also enables bulk event creation and configuring event-to-object relationships.
Using the import wizard, an event will follow the raw data if it fits one of the three supported structures:
A column(s) of the table represent an event(s)
A row in the table represents an event (as an event log)
A row in the table represents an event (change table with old value / new value)
To learn more about creating events from tables, see: Events.
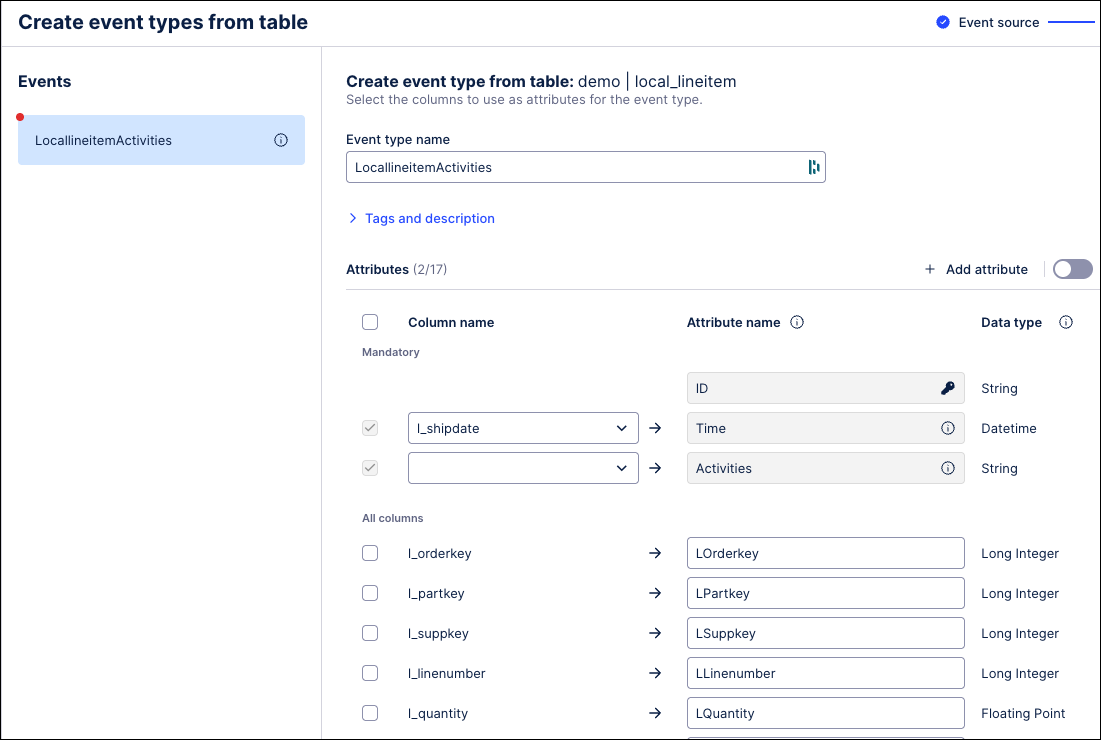 |
February 24, 2026
IMPROVED AUTOMATION Updates to Task Types
You can now easily copy Task Types across your Celonis Platform instance to a different team, space, and package. See Copying Tasks Types.
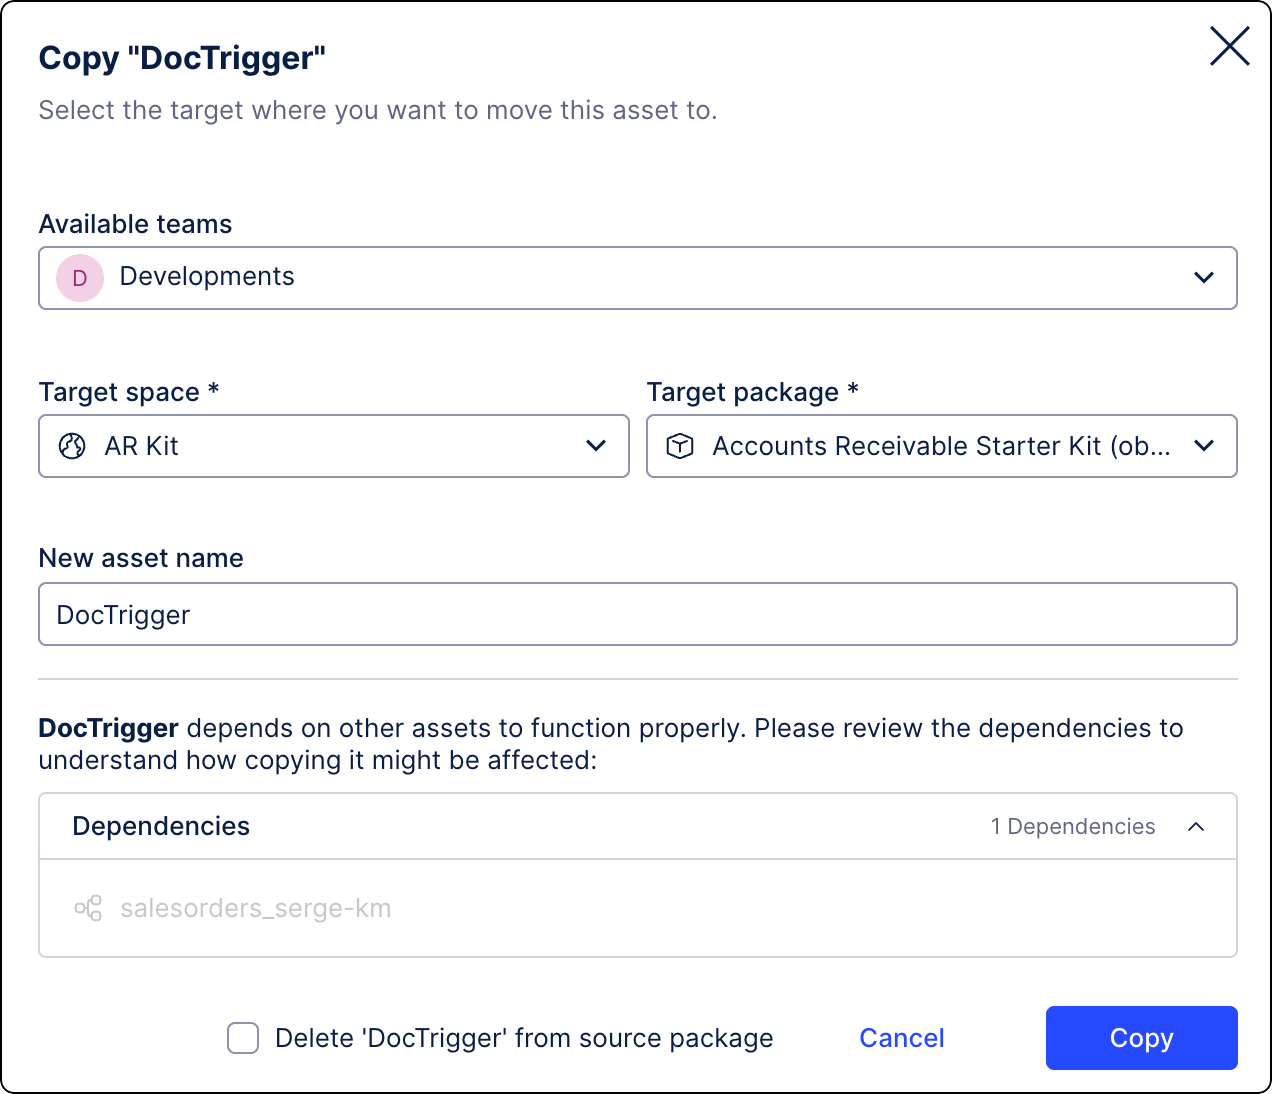
We’ve added a Task Type Status column to the Task Management screen to help you monitor the health of your Tasks. The column displays the current status and flags errors in two categories: errors (critical errors) and warnings (operational issues). For more information, see Troubleshooting Task Types.
NEW AUTOMATION STUDIO Call Process Copilots from your Action Flow modules
Action Flows are being upgraded with a new module that can be used to trigger your existing Process Copilots. This new “Call Process Copilot” module is used to create custom messages that are passed in real-time to your Process Copilot assets. Adding this module removes the need to create workaround solutions using custom code in order to connect your Action Flows to your Process Copilots.
The module can be configured by selecting your connection and the Process Copilot you want to connect to from this Action Flow. You can then create the custom message you want to send using both plain text and Action Flow variables. When the Action Flow is executed, the responses from the Process Copilot are displayed automatically and include the response, the reasoning, and the conversation ID. These calls can also be tracked on the Process Copilot Monitoring screen.
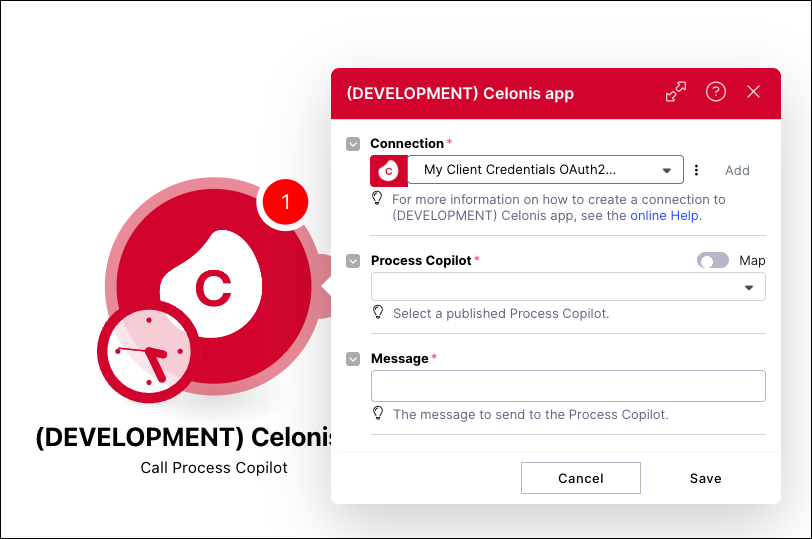
For more information, see Call from Action Flows.
IMPROVED OBJECTS AND EVENTS Attribute sorting added to objects and events
You can now manually control the display order of attributes for your objects and events, which were previously ordered alphabetically. After updating the attribute order and deploying your changes to development or production, the new order will be reflected in both your transformation jobs and the Knowledge Model.
While attribute ordering doesn't impact processing logic, it improves readability, usability, and governance by allowing you to present your data in a logical and consistent structure.
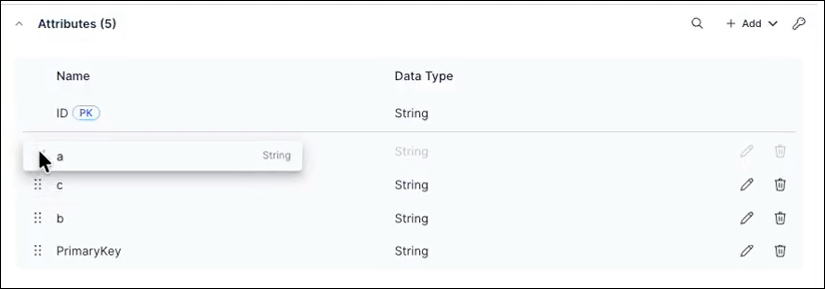
To learn more about creating and managing objects and events, see: Objects.
February 23, 2026
NEW STUDIO Switching annotation lines between primary and secondary chart axes
You can use annotation lines in charts to indicate thresholds and targets. Annotation lines are displayed by default for the primary axis of your chart. If your chart has both primary and secondary axes, you can now toggle annotation lines between these axes using the Annotation line settings panel:
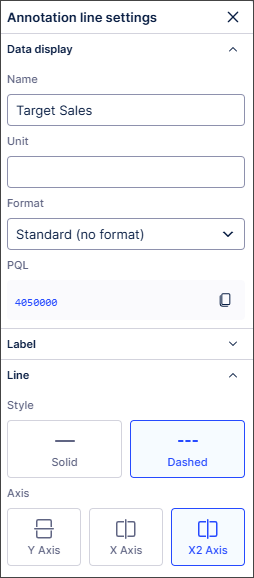
The annotation lines will track correctly against the scales used for each axis, ensuring they are always contextually accurate.
For more information, see Chart annotation lines.
NEW TASK MINING Task Mining Client software version 2.21.0
We've released a new version of the Task Mining Client software. This version includes general improvements.
In addition, we’ve added the remote suspension of Task Mining data capture for Private Preview customers only.
For more information, see the Task Mining install file release notes.
And for more information about our private preview releases, see Feature release types.
PUBLIC PREVIEW STUDIO Performance Spectrum component added to Views
With this public preview release, you can now add a Performance Spectrum component to your Studio Views.
Traditional process explorers show aggregated views that can overlook real process dynamics. The Performance Spectrum adds a time-based perspective, revealing how tasks interact and evolve. It highlights variations, bottlenecks, and performance shifts that are often hidden in aggregations, giving you clearer insights into how your processes truly run.
In this example, the Performance Spectrum helps a government agency to visualize how individual fines move through a defined sequence over time. This helps them to identify bottlenecks and validate that specific process patterns (like batching) are adhered to and stay consistent over time (e.g. throughout the year).
To understand more about this use case and to learn how to configure and use the Performance Spectrum, see: Performance Spectrum
And to read more about our private and public preview releases, see: Feature release types.
PUBLIC PREVIEW OBJECTS AND EVENTS Define composite primary keys on object-centric data model attributes
For source systems where uniqueness is defined by multiple attributes, Objects and Events now supports composite primary keys. Composite primary keys allow you to define a primary key using more than one attribute directly in the data model. This removes the need to manually concatenate attributes in transformation logic and helps improve query performance.
Previously, all object and event types in the object-centric data model required a single ID attribute with a String data type. This attribute served as the PK, uniquely identifying each row and enabling joins across objects and events. For source systems with composite PK (multiple columns), users had to manually concatenate these columns into a single ID using SQL transformations.
You can now define the PK for objects and events in one of two ways:
Single ID attribute (legacy approach): Provide your own ID column as the PK, as before.
Composite PK: Select multiple attributes to form a composite PK.
For more information, including a step-by-step guide to defining composite primary keys, see: Composite primary keys.
February 19, 2026
NEW STUDIO Agent Tools (MCP) now in General Availability
The Agent Tools (MCP) feature is a new Studio Asset that enables AI agents to securely access and interact with Celonis data and insights using the Model Context Protocol (MCP). The Agent Tools asset provides ready-to-use tools that can be used by AI agents to search for relevant information, retrieve real-time process context, trigger actions in external systems, and write decisions back to the Celonis Platform.
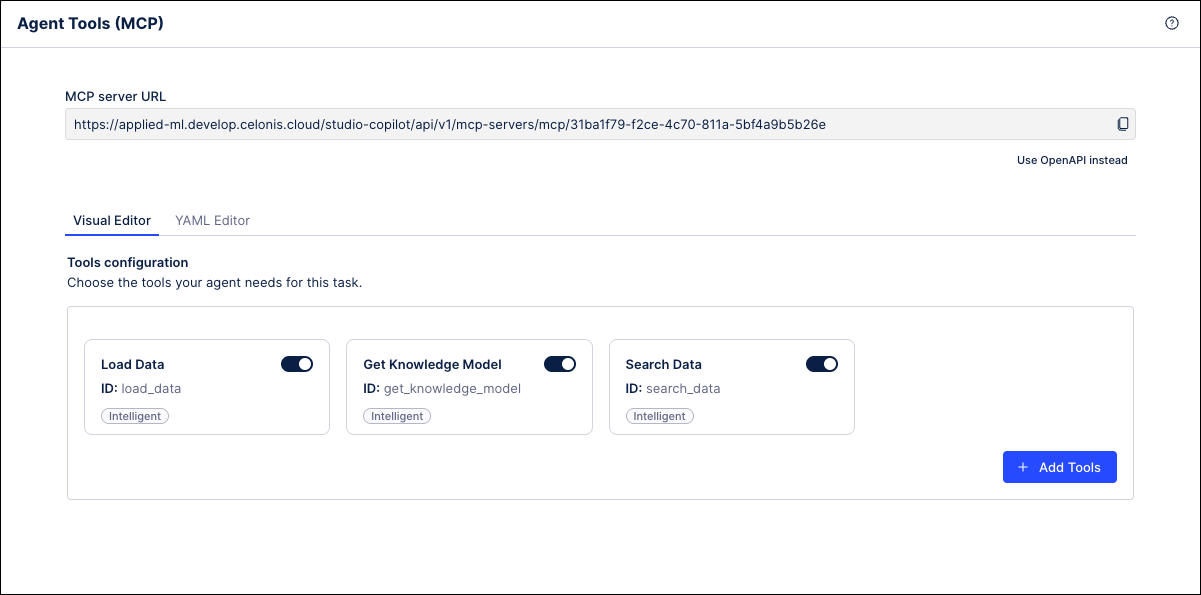 |
Agent Tools can be created as new assets in Studio and then configured with the tools you want to make available to AI agents through the MCP. These tools can include data retrieval functions, insight generators, knowledge model queries, and more. Once the new asset is published, it will generate a unique URL that serves as an endpoint that can be connected to by other MCP clients.
For more information, refer to Agent Tools (MCP) in the Celonis Developer Center.
February 18, 2026
IMPROVEDPROCESS DESIGNER PROCESS NAVIGATOR Process Cockpit updates
We've updated the Process Cockpit to be more intuitive and user friendly.
UI Changes
The selected date range is now located in the user menu. By default, it shows the last 30 calendar days.
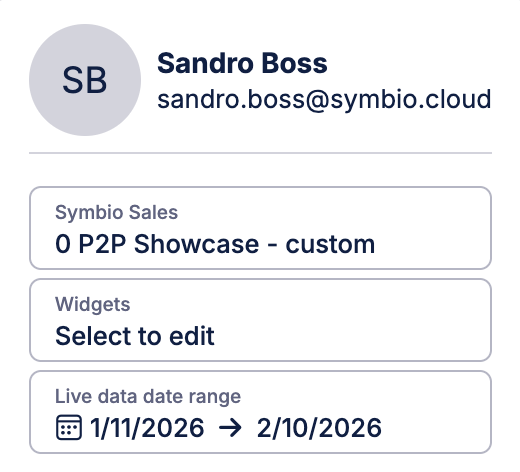
In Process Navigator, the Process Journey view now has a Live Data Card that shows the selected date range (for customers using the Canvas app, this card can also be seen in Process Designer)
The live data check now has a message explaining the difference between what is seen in Process Designer and how it is displayed in Process Navigator
Performance enhancements
Live data values are now rounded to two digits after the comma
When the user selects % as a unit, the selected value will be recalculated to be displayed as a percentage (x 100)
For more information, refer to Activating and configuring live data and Process Cockpit.
IMPROVED PROCESS DESIGNER Bugfixes
This release focuses on "under-the-hood" excellence and highly requested fixes for escalated customers:
Improved loading speeds for the Orphan view
Enhanced security and data consistency across the platform
UI updates:
Added alphabetical sorting for corona objects (to improve searchability)
Resolved the "grayed out" Refresh button issue
February 16, 2026
REMOVED BUSINESS MINER Business Miner service removed from the platform
Our Business Miner service has been removed from the platform and has already been replaced by our AI-driven Insight Explorer and Studio features.
With these advanced capabilities, you’ll benefit from:
Enhanced intelligence: Advanced AI integration and deeper customization options.
No additional cost: These features are already included in your Celonis Platform offering and can be used today at no extra cost.
Easy transition: With our Celonis Academy course, you can efficiently transition away from Business Miner.
As a result of the removal of this service, the Business Miner navigation item has been removed from the navigation bar and no users can access the service. As our Quickstarts feature rely on the use of Business Miner features, we have also removed these from the platform.
To get started with Insight Explorer, see: Insight Explorer.
REMOVED DATA INTEGRATION Quickstarts options removed from platform
Following the deprecation of the Business Miner service, the associated data integration Quickstarts have been removed from the platform. As these Quickstarts were only used to establish initial connections to source systems, this change does not affect existing workflows - any connections created with a Quickstart will continue to function as before.
To learn how to connect your source system to the Celonis Platform using our Extractor Builder options, see: Connecting data sources
February 12, 2026
NEW STUDIO Process Copilot Smart Routing
You can now create a “router” Process Copilot in Studio and use it to choose the correct tool for your specified task. To take advantage of this router Process Copilot, you can build a series of focused Process Copilots with specific skills or for a defined scope and then surface them as tools to the router. Then your users can interact with the router and use it to perform any of the tasks provided by the associated tools.
For example, you can build one Process Copilot per domain or one Process Copilot for each task. This allows each Process Copilot to keep its focus narrow and maintain high quality. You can then expose each of these focused Process Copilots as individual tools to the router Process Copilot. The router can then search these tools to find the Process Copilot that best fits the needs of each request.
Note
Each call to a Process Copilot being used as a tool is made with a new id, so the chat history is not preserved from previous calls made to that same tool.
When creating the Process Copilots to be used as tools, it is important to provide clear and accurate descriptions to help the router identify its functionality. Each of the Process Copilots being surfaced as tools must be published in the same Space as the router.
February 11, 2026
PRIVATE STUDIO Consistent event log colors across Process Mining Components
With this private preview release, the colors assigned to event logs will remain consistent across all your process mining components and assets. This means that the color assigned in the Event Log Builder or visual editor will be used for that event log in all of your process mining components, such as Process Explorer, Variant Explorer, Process Adherence Manager (PAM), Event Explorer, Case Explorer, Throughput Time (TPT) Explorer and any associated process filters. If the assigned color is changed in the Event Log Builder or visual editor, the change will be updated automatically across all components.
As part of this release, the color palette used for event log colors has been refreshed to make the available colors easier to distinguish from one another and improve the accessibility of the colors used in the process mining components.
To learn more about our Private Preview releases, see: Feature release types.
IMPROVED STUDIO New object-centric performance metrics in Event Explorer
The new Synchronization tab introduces object-centric performance metrics in the Event Explorer component, which allow you to analyze the arrival times of various objects at specific interaction points in the process. These new metrics include:
Event Lead Time: The total duration from when the earliest input object becomes available to the completion of that specific event. Event Lead Time can be thought of as the total amount of time needed for the preparation and execution of all steps in the process.
Synchronization (Sync) Time: The time between when the first and last input objects arrive at a shared event. Sync Time captures the delay caused by waiting for all involved objects to be ready.
Execution Time: Amount of time from when all input objects are available to when execution is complete. During this period, all objects are ready and nothing is blocked on the data side, but no action occurs.
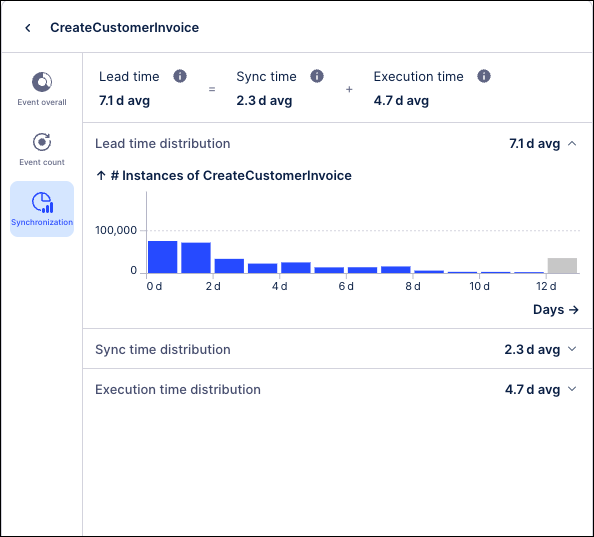 |
These metrics are computed for all shared events in the process and can be viewed on the Synchronization tab in the Event Explorer by clicking the arrow to the right of the Event logs column. The Synchronization tab shows the range of times for each metric and how frequently each time value occurred across the events in this process.
These metrics are available out-of-the-box and can help to identify critical bottlenecks in your processes such as:
How long does it take events with multiple objects/shared events/events requiring multiple inputs to complete? (Event Lead Time)
How much time is spent waiting for all inputs to arrive? (Sync Time)
How long does a process idle once all inputs are ready? (Execution Time)
For more information, see Event Explorer Component.
NEW ADMIN AND SETTINGS Choosing Celonis Platform themes
You can now choose the color theme used in the Celonis Platform, allowing you to adjust the user interface colors and contrast to suit your needs.
You can select the following preset themes from your user profile management screen:
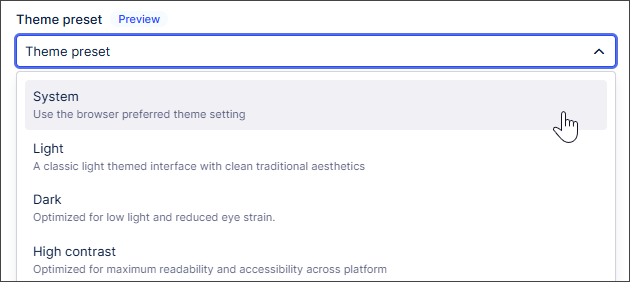 |
System: Uses the browser preferred theme settings.
Light (default): Classic, clean light-themed interface.
Dark: Optimized for low light and reduced eye strain.
High Contrast: Designed for maximum readability and accessibility.
You can also switch between light and dark color themes from Studio Package settings:
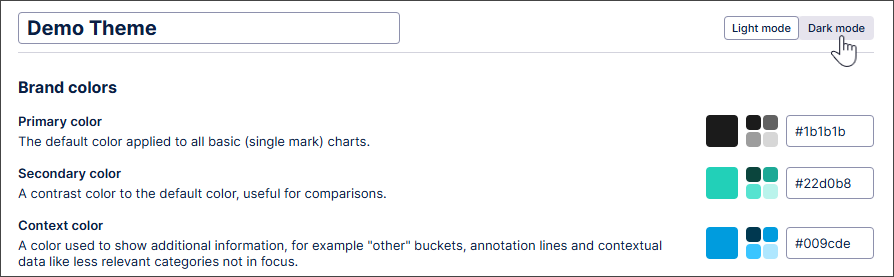 |
With the addition of the dark mode platform theme, we've also expanded Studio color themes to support dark mode-specific color options. This means you can ensure your custom brand color themes remain readable even when users have dark mode enabled.
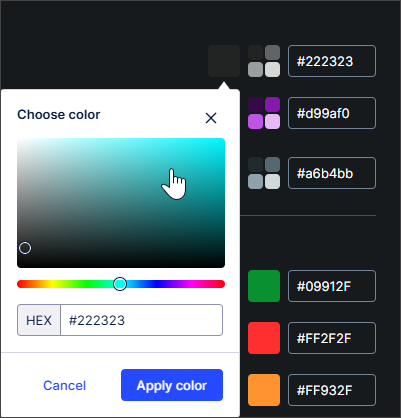 |
The dark mode colors match light mode by default. Users can manually override these colors to provide better contrast or visibility against dark backgrounds. This customization specifically applies to Custom Brand Color Themes; Celonis default themes already include automatic translation for dark mode support.
Note
The following products do not support themes: Analysis, Action Flows, Advanced Views, Simulation Asset, Transformation Center, Business Miner, Forms, and Celonis Process Management (CPM).
For more information about choosing the theme for your Celonis Platform experience, see Managing your user profile. And to find out more about colors in Studio Views, see Color themes.
February 9, 2026
FIXED TASK MINING Incorrect labeling of some Microsoft applications
We've fixed an issue with the incorrect labeling of some applications in Task Mining.
Previously, Microsoft applications such as Microsoft Outlook were sometimes automatically and incorrectly labeled as Microsoft Teams, potentially giving an inaccurate view of the amount of time users spend using Microsoft Teams.
With this fix, all Microsoft applications will now be labeled correctly during Task Mining. This fix will be automatically applied to all current Task Mining projects and may result in changes to your Workforce Productivity app data for those Task Mining projects.
For more information, see Task Mining default Labels: Microsoft Office. And to find out more about the Workforce Productivity app, see Working with Task Mining data.
February 6, 2026
REMOVED BUSINESS MINER Deprecating Business Miner service
Our Business Miner service is being deprecated and has already been replaced by our AI-driven Insight Explorer and Studio features.
With these advanced capabilities, you’ll benefit from:
Enhanced intelligence: Advanced AI integration and deeper customization options.
No additional cost: These features are already included in your Celonis Platform offering and can be used today at no extra cost.
Easy transition: With our Celonis Academy course, you can efficiently transition away from Business Miner.
To prepare for this deprecation, the Business Miner navigation item has been moved down a level and an in-platform notification informs your users of the forthcoming deprecation. As our Quickstarts feature rely on the use of Business Miner features, we have also removed these from the platform.
And to get started with Insight Explorer, see: Insight Explorer
IMPROVED OBJECTS AND EVENTS Improved control over catalog updates
Teams using Celonis core-process catalog v3.0.0 or higher now benefit from two enhancements to both automatic and manual catalog update workflows.
Auto-updates: Catalog auto updates now apply only to minor and patch releases to reduce the risk of unexpected breaking changes. Upgrading to a major release now requires a manual catalog update.
Manual updates: You can now choose whether to upgrade to the latest major version or stay on the latest minor/patch update.
To learn more about updating your catalog version, see: Core process catalog.
PRIVATE STUDIO Technical connection for View Reports
When scheduling and managing your View Reports, you can now choose between creating a personal connection, where the report is linked to an individual user in the team, or a technical connection.
A technical connection allows you to link a report or report trigger to a team account instead of an individual user in the Celonis Platform. By assigning View permissions to this connection, the report or trigger remains accessible and active even if the original creator leaves the team or loses Celonis Platform access.
In this example, the report is configured for a technical connection:
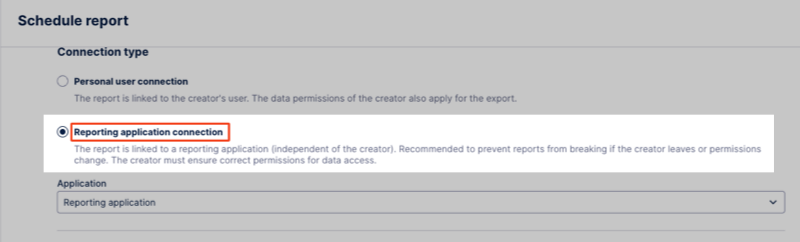 |
To create a technical connection, a team admin must create a reporting application in the Admin & Settings area. For more information, see: Technical connection for View reports.
And to learn more about scheduling and managing View reports, see: View Reports.
February 5, 2026
PRIVATE STUDIO Migrating translations from an Analysis to a View
With this Private Preview release, you can now import translations from a Data Model to a Studio package.
Translations in an Analysis use Data Model name mappings. In Views, translations are saved in the package settings. To migrate translations, the name mappings can now be imported to the package settings.
When migrating an Analysis to a View, the translation syntax is automatically updated during the migration and uses the translation keys from the package, with no changes required in the Analysis or View. Users can then select their preferred language from the View Translations menu.
For more information about migrating Analyses, see Migrating Analysis to Views and for information specific to this functionality, see Migrating translations from an Analysis to a View.
And for more information about our private preview releases, see Feature release types.
IMPROVED AUTOMATION OAuth 2.0 available for Action Flows
We’re introducing OAuth 2.0 as a connection method for all Celonis Action Flow modules. This industry-standard framework allows applications to interact securely on your behalf without sharing sensitive credentials. You can find OAuth as a connection type in Action Flow modules. This connection type requires a Celonis Admin to create an OAuth client first to obtain client ID and client secret (basic type). See Adding OAuth client to Celonis Platform.
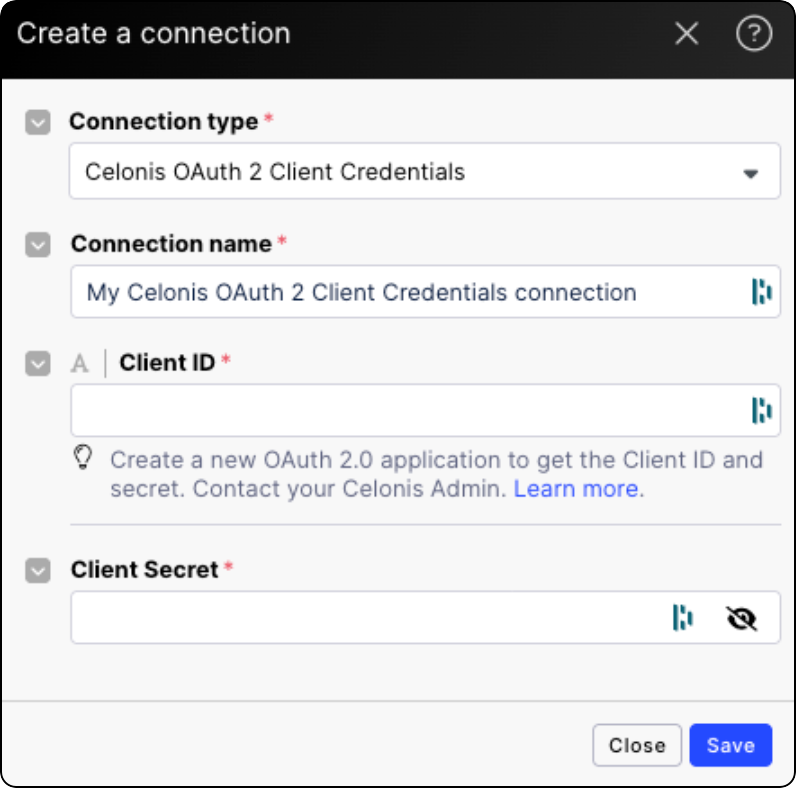
February 4, 2026
NEW AUTOMATION Annotation Builder in Process Orchestration
Annotation Builder, our AI-enhanced Studio asset for processing and labeling data, can now be used as a starting step for Process Orchestrations. This allows you to automatically trigger subsequent orchestration steps based on the specific findings and labels generated within Annotation Builder.
For more information, see Annotation Builder and Orchestration Engine.
IMPROVED ADMIN AND SETTINGS Improved permissions management experience
We’re introducing a refreshed permissions management experience that improves how administrators view and manage access across the platform.
This release includes:
A single, consolidated admin interface for viewing, granting, and managing permissions within Admin & Settings.
A new permissions interface that replaces checkbox-based controls with a chip-based model, making it clearer and easier to grant or remove permissions across users and teams.
An updated central authorization service that supports the new permissions experience.
While this update focuses on improving clarity, consistency, and usability for administrators, the underlying permission model remains unchanged:
There are no changes to permission behavior, access levels, or role definitions.
Existing user access remains exactly the same.
To learn more about managing your user permissions, see: Managing permissions.
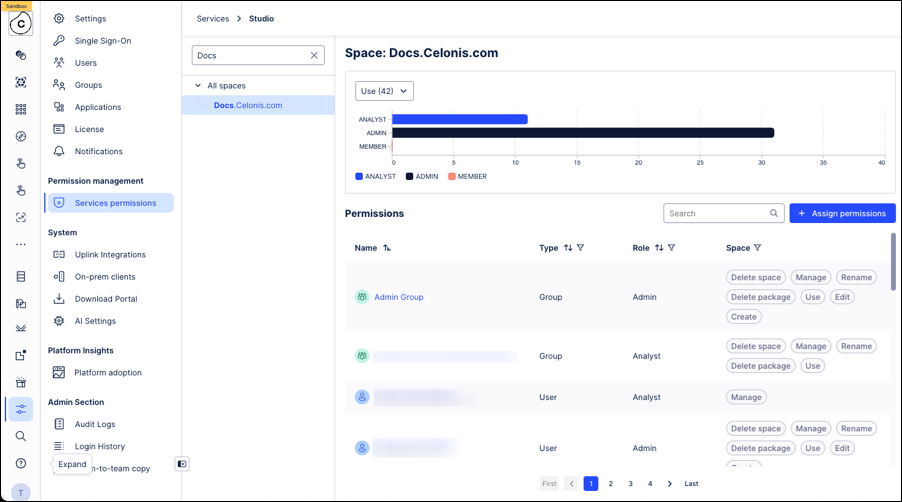
IMPROVED OBJECTS AND EVENTS Updated Related Objects interface for one-to-one relationships
The interface for the Relationships to objects tab in the Objects and Events module has been updated to provide a clearer overview of your object-to-object relationships. In this new interface, the Outgoing and Incoming tabs have been replaced with a single list that shows all your one-to-one relationships on one page.
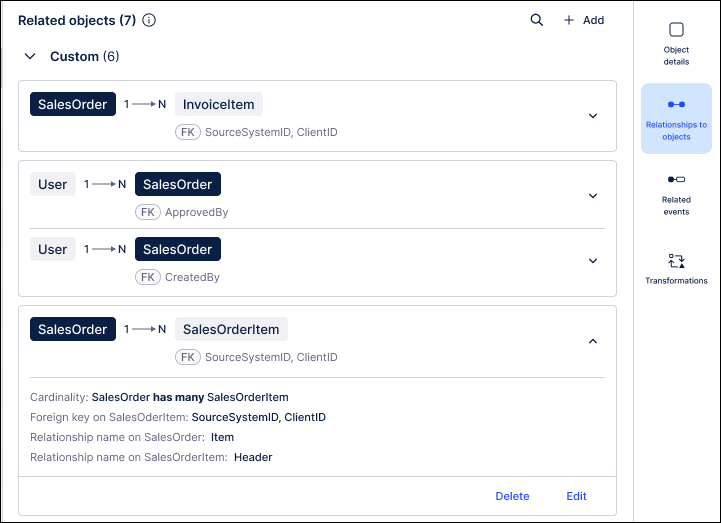
In this new list, the positioning of the objects on the card is meant to reflect their positioning within the relationship. For example, all one-to-many relationships will display the 1-sided object on the left. For many-to-many relationships, the current object will be displayed on the left. If there is a join table in the relationship, it will be displayed between the two objects.
 |
The list also uses the color of the chips to differentiate between the objects in the relationship. A dark chip will always be used for the current object and a light chip is displayed for the other objects. You can also click on a light chip to be taken to the page for that object.
For more information, see: Modeling objects and events.
February 2, 2026
PRIVATE STUDIO Insight generation within Views
With this Private Preview release, you can now generate Insights from within Views.
Previously, users generated Insights about their data in Insight Explorer before exporting them to Views. Now users can create Insights directly within Views containing KPI list or card components and apply the resulting Insight filters directly to their View.
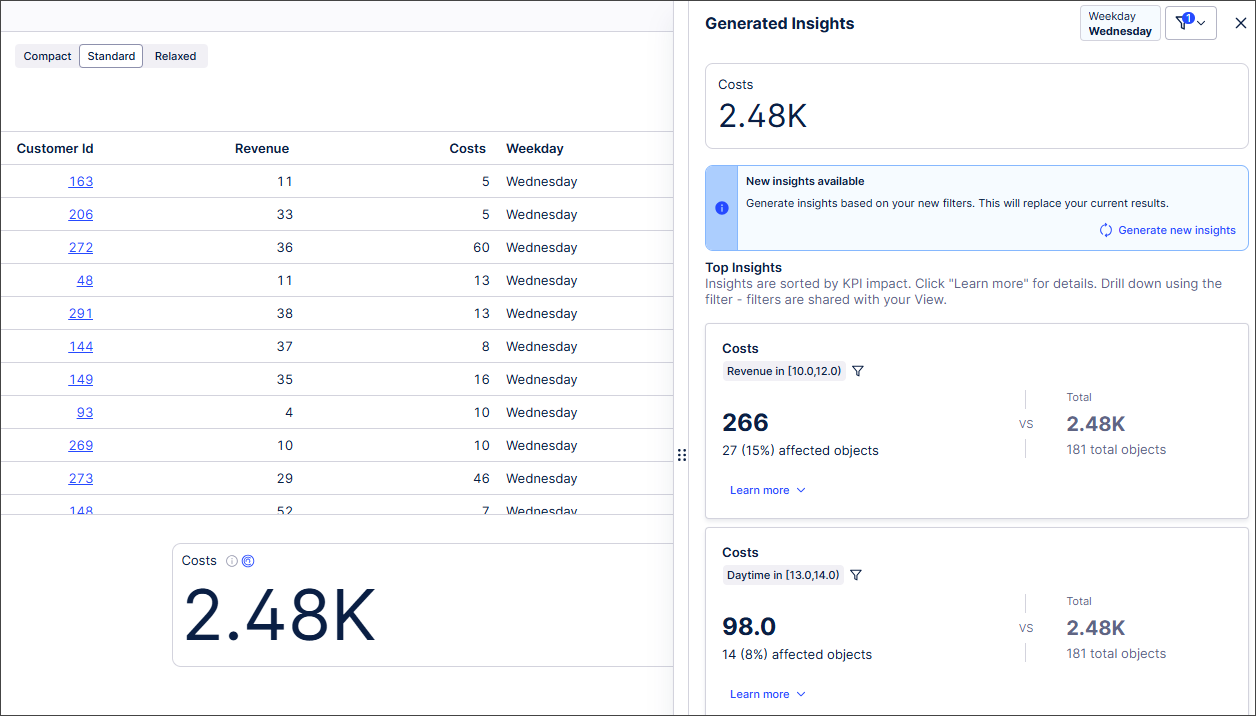 |
For more information, see Generating Insights in a View.
And for more information about our private preview releases, see Feature release types.
IMPROVED STUDIO Visual enhancements for View components
We’ve refreshed several View components with visual and functional updates to improve the look, feel, and usability of your dashboards and applications. These changes reduce wasted space, standardize the UI, and add new customization options for greater information density.
The highlights include:
Optimized KPI values: KPI values now scale to utilize more of the space available within the component.
Cleaner clickable KPIs: We removed wasted space around the clickable elements in clickable KPI list variation, and the unnecessary arrow was removed, resulting in a cleaner look and better space utilization.
For example, this was the previous clickable KPI:

And with the visual enhancements:
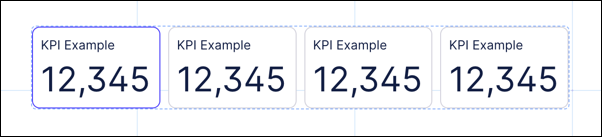
Removing unnecessary text: For the KPI Card, the "Related KPI" title is now only shown if trends are also enabled. When no trends are present, the title is removed to allow more space for the KPI values.
Reduced space between component and header: Many components had excessive spacing between the component and the header text. This has been reduced and standardized across all components.
For example, this was the previous chart component:
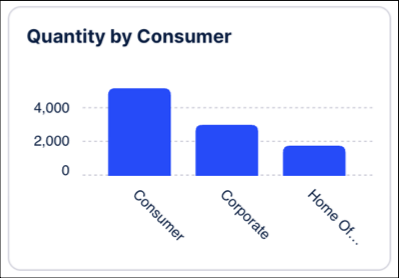
And now with the visual enhancements:
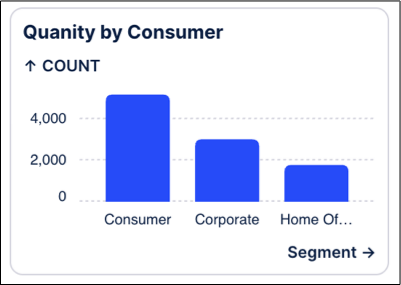
IMPROVED DATA INTEGRATION Increased string length limit for Cloud Extractors
Previously, Celonis limited string values in Cloud Extractors to a maximum of 80 characters. Based on customer feedback, this character limit has been increased. Cloud Extractors now support string values of up to 8 KB, with an increase to 65 KB planned in the coming weeks.
Important: Celonis dynamically determines column widths based on actual data to optimize performance and avoid unnecessary processing overhead. However, manually created tables, especially VARCHAR columns defined during the transformation phase, may require manual adjustment if incoming values exceed the existing column size.
If column widths are not updated, you may encounter transformation errors such as:
String of 82 octets is too long for type Varchar(80)
For extraction task best practice, see: VARCHAR optimization.
January 30, 2026
IMPROVED STUDIO Reusing View modules across packages
You can now use View modules across different Studio packages.
Previously, you could only reuse modules within your own package. This new functionality gives increased flexibility by allowing View module reuse across packages. Published changes to the reused View Module can be updated as required.
For more information, see Reusing View modules across packages.
January 29, 2026
PRIVATE STUDIO Reusing View modules across packages
With this Private Preview release, you can now use View modules across different Studio packages.
Previously, you could only reuse modules within your own package. This new functionality gives increased flexibility by allowing View module reuse across packages. Published changes to the reused View Module can be updated as required.
For more information, see Reusing View modules across packages.
January 28, 2026
NEW PROCESS DESIGNER LeanIX/CPM integration
We've released an integration that allows you to pull data from LeanIX and use it within Process Designer. You can access this integration via the Celonis Marketplace.
For more information on how to set up the integration, refer to LeanIX - Celonis Process Management integration.
NEW STUDIO Dimension switching in charts
Dimension switching enables faster, more flexible self-service analysis, allowing users to explore multiple data perspectives within a single chart for quicker insights and a better experience.
Users can now dynamically adjust the data in bar, column, line, and area charts by enabling dimension switching.
Previously, users couldn't easily switch between visualizing data on a weekly and a monthly basis.
With dimension switching, users can now change the data perspective displayed using a simple dropdown in the chart.
In this example, the user can select whether to display the Sum data by Ship Mode, State or City.
|
To find out more, see Switching dimensions in charts.
IMPROVED STUDIO Unifying Internal and External Process Copilots
The process for creating Process Copilots is being simplified by removing the need to specify between internal and external assets on the Create Process Copilot screen. Instead, all Process Copilots will have the option to be enabled for external use and you will be able to send both internal and external calls from the chat interface.
To make your Process Copilots externally available, you will enable the toggle switch in the new External Use section of the configuration screen to activate this asset for external API access. Once enabled, you can either copy the URL for the API or export the JSON code to use with your external tools. Any tools in this Process Copilot that are not available via API will be listed below the API URL field.
Note
Calls made using the external API will display on the Process Copilot Monitoring screen with a location of “External API”.
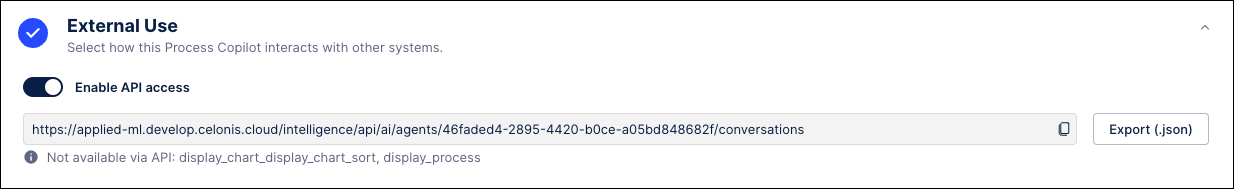
Any existing Process Copilots that were created to be external assets will be migrated to the new format automatically. All existing APIs will remain unchanged and the external API access for these assets will be enabled by default to ensure they continue to function.
For more information, see Creating Process Copilots.
January 26, 2026
IMPROVED STUDIO Usability enhancements for asset-to-asset dependencies
We've made a couple of small usability enhancements to asset-to-asset dependencies in Studio.
You can now drag and drop the asset dependencies modal, giving you greater flexibility about how Studio is displayed. You can also filter dependencies by asset type.
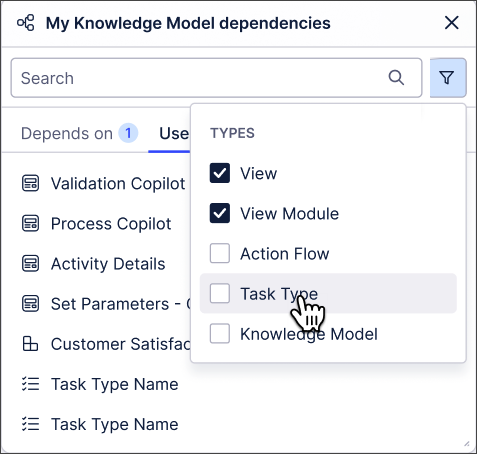 |
For more information about asset-to-asset dependencies, see Asset-to-asset dependencies.
January 22, 2026
IMPROVED STUDIO New AI-generated inefficiency metrics in Insight Explorer
Insight Explorer is getting upgraded to use AI capabilities to detect process inefficiencies within your event logs. These AI-generated metrics can be selected from the new Metric Recommendations section on the Metrics tab of your Insight Explorer configuration, allowing you to select pre-configured metrics that don’t currently exist in your Knowledge Model. Just select an event log and AI will generate process inefficiency metrics based on the selected event log that can be added and analyzed in Insight Explorer.
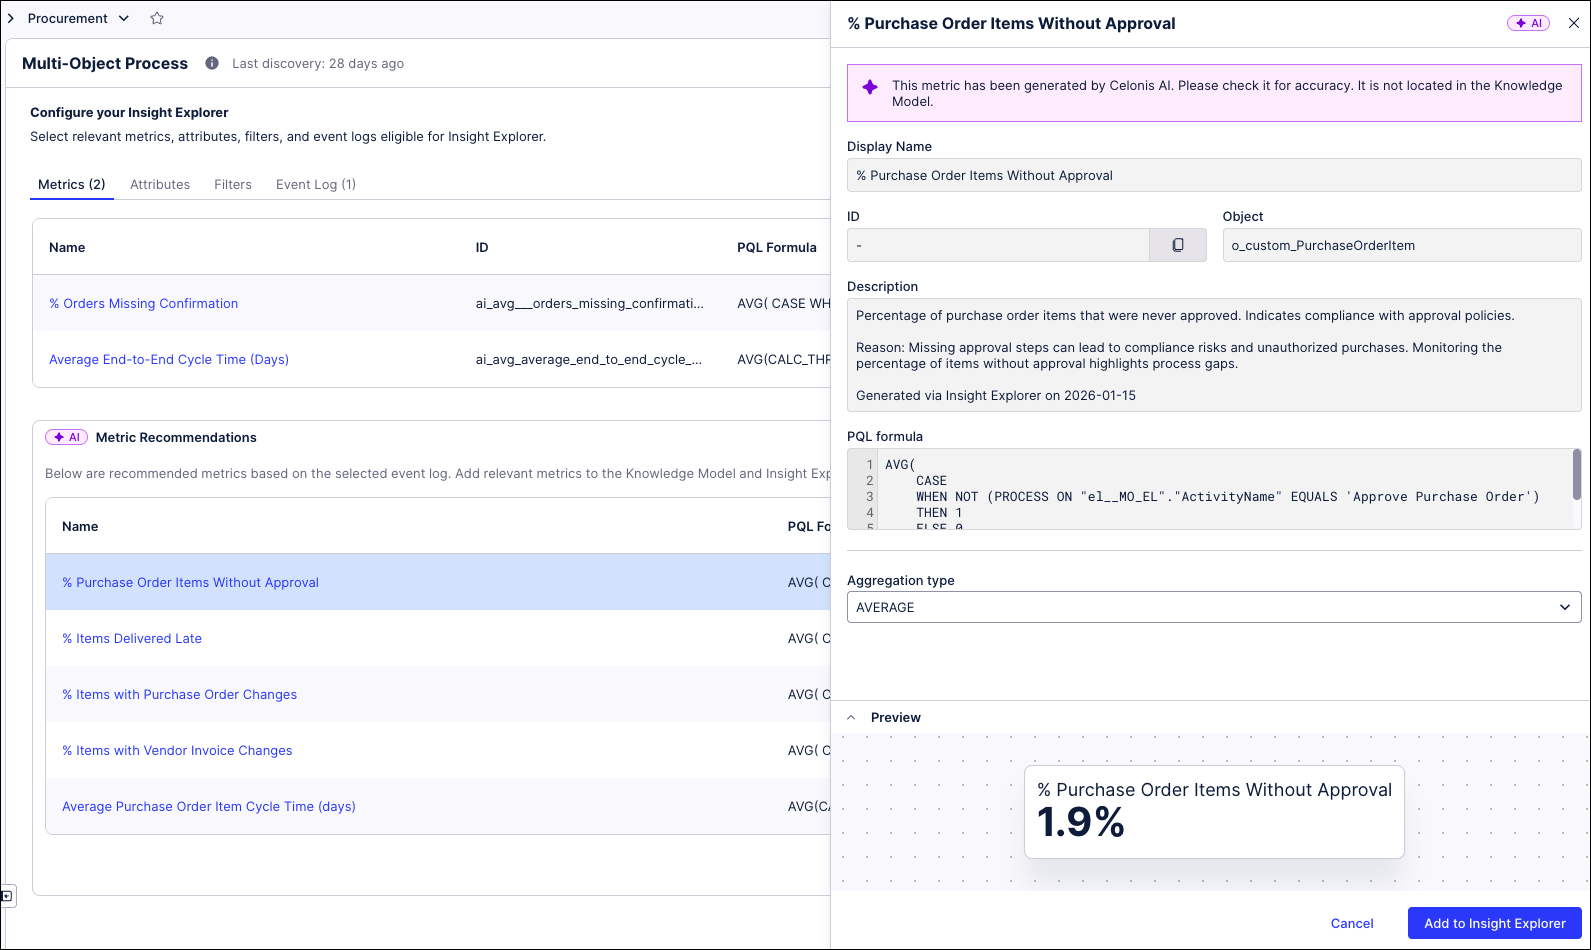 |
To add one of the recommended metrics, click on the metric name to view the details and then click the Add to Insight Explorer button to add this metric to your configuration. Insights can then be generated to deep dive into those process inefficiencies.
For more information, see Configuring an Insight Explorer.
IMPROVED STUDIO Layout upgrades to the multi-object Process Explorer graph
In order to reduce the perceived complexity and increase the understandability of the Multi Object Process Explorer (MOPE) graph, a number of improvements are being introduced to the process graph layout and performance, including:
Highlighting of new elements - When adding events or connections, the updated portion of the graph will be highlighted to show what was added.
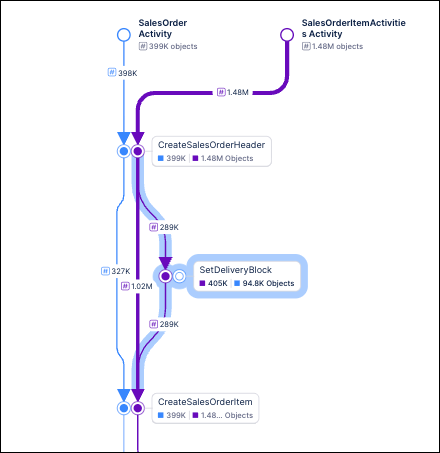
Larger arrowheads - The arrowheads on the process graph are now larger, making it easier to quickly identify the direction of edges. This change is especially helpful when viewing larger or more complex graphs.
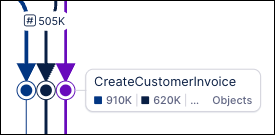
Reduced zooming - When using the slider controls to add or remove events or connections from the process graph, the current level of zoom is maintained. For example, if you are viewing your process graph at 75% zoom and then add new events or connections, the graph will update but remain at 75% zoom. Previously, the graph would zoom out to show the entire process each time it was updated.
Improved connection routing - Makes it easier to identify loops and keeps the process graph more compact.
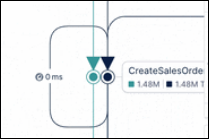
NEW BUSINESS APPS Data Model Tasks included in Inbox
The Tasks Inbox now includes Tasks triggered from Data Models (identifier-based), alongside existing record-based Task. This ensures that all tasks raised for users across Celonis Platform are accessible in one centralized location. For more information, see Inbox.
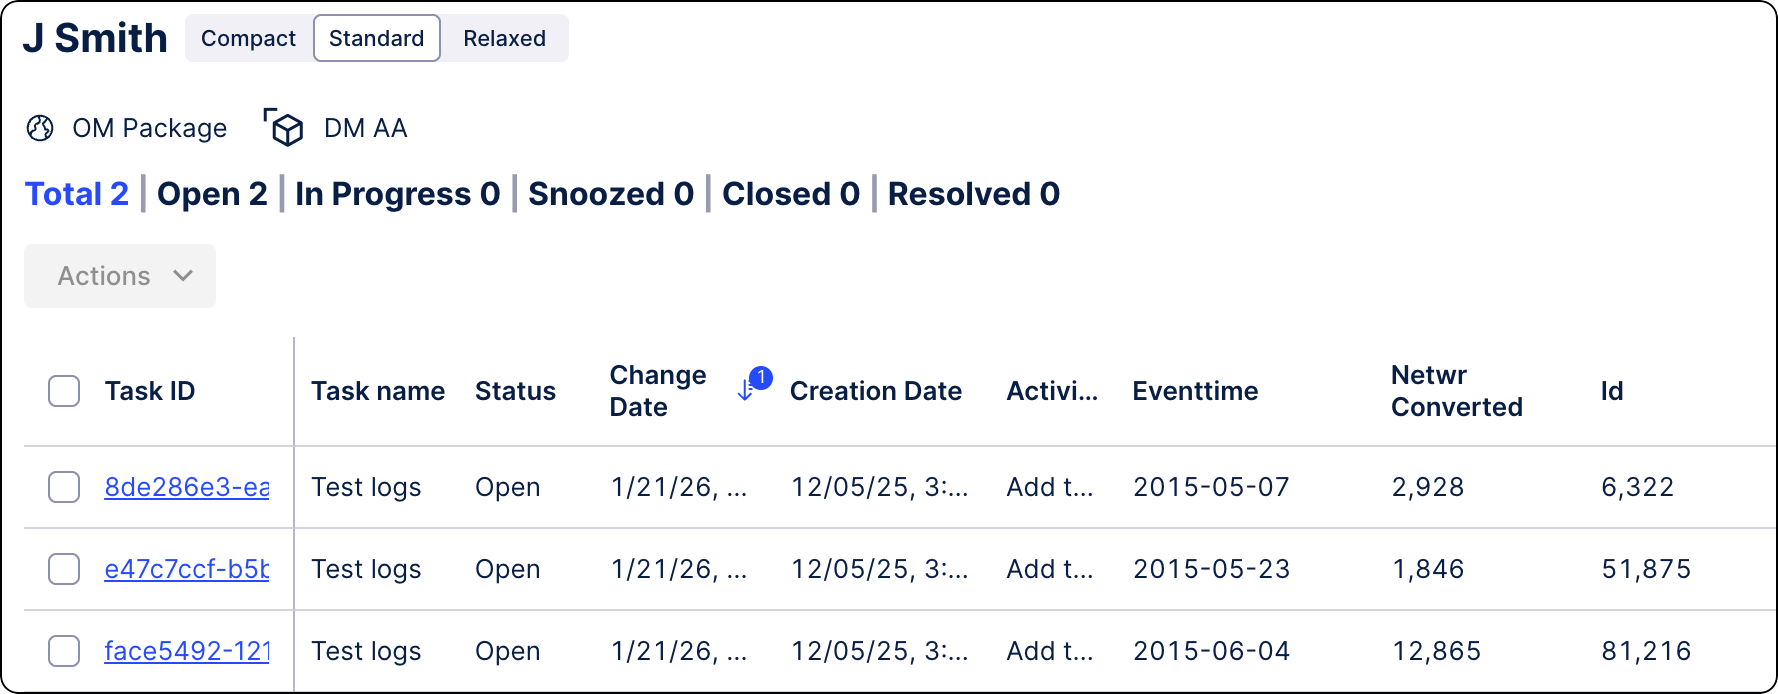
IMPROVED DATA INTEGRATION Enhanced and refreshed SQL editor
When creating or editing SQL transformation jobs, you can now use the enhanced, refreshed SQL editor by default. Previously available in our Objects and Events product area, this editor builds on the existing feature set while providing a more consistent experience across the platform.
In addition to searching existing statements, browsing tables from your data sources, and creating parameters, you can now open and work with multiple transformations at the same time:
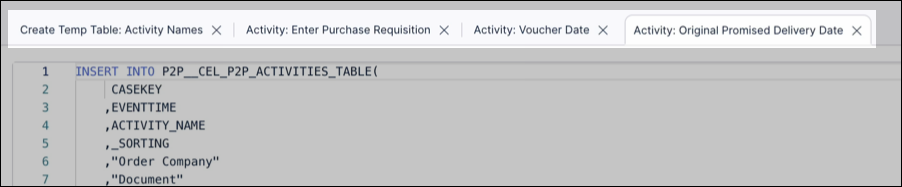
While the enhanced SQL editor loads by default, you can also return to the previous experience by clicking Old SQL editor within a transformation:
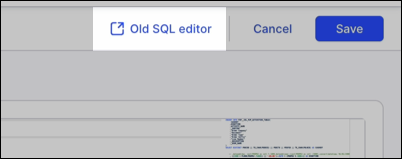
To learn more about creating transformations, see: Extracting and transforming data.
January 21, 2026
IMPROVED STUDIO Group package assets
You can now group Studio package assets by type, functionality, or custom criteria. You can also sort each group and create new asset types directly within it.
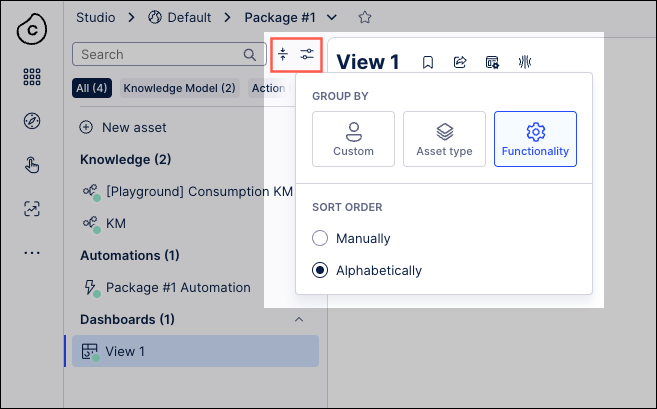
To learn more about managing your Studio package assets, see Managing packages and permissions.
NEW STUDIO Control analyst access to Annotation Builder, Insight Explorer, and Process Copilot assets
With this release, admin users can now control which analysts can access, view, and edit Annotation Builder, Insight Explorer, and Process Copilot assets. This change creates an additional level of protection against unintended or negative consequences related to their use.
For more information, see the documentation for Annotation Builder, Insight Explorer, and Control analyst access to Process Copilot assets.
Note
This functionality is only available upon request. To enable it in your environment, contact us at Celonis Support.
January 19, 2026
IMPROVED STUDIO Exporting linked Views as PDF
In addition to exporting a main View as a PDF, you can now export a linked View while in view mode, either in Studio or in a published app. This enhancement lets you create shareable, offline versions of your data outside the Celonis Platform. You can also select multiple tabs, add page numbers, and adjust the PDF scale and orientation.
To export your Studio View or linked View as a PDF while in view mode (in Studio or Apps), click Share - Export PDF:
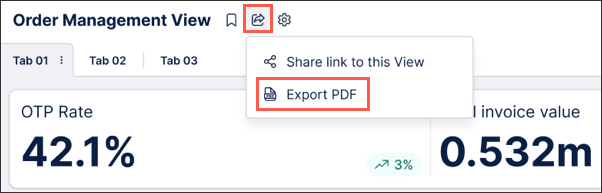
To learn more about exporting your Studio Views, see: Exporting Views.
January 15, 2026
NEW STUDIO Stacking and grouping metrics across dimensions for bar and column charts
You can now quickly and easily split bar and column charts in Views across dimensions, letting you create stacked or grouped charts that adapt seamlessly to your data and provide accurate and meaningful data visualization.
Previously, creating stacked/grouped bar and column charts involved stacking/grouping multiple metrics and manually defining each stack or group in the bar or column chart individually. This required significant effort for larger data sets and was impractical when dealing with dynamic data as multiple metrics needed to be added and maintained.
This new feature lets you select which metrics are used to stack or group your data, set the ordering to ascending or descending and define how many stacks or groups are displayed (maximum of 20). You can also limit the number of data points displayed in the chart overall in the Data Settings section of the chart component which is useful when working with large data sets. In addition, you can choose the display colors for the different dimensions within each stack or group.
In this example, the bar chart displays multiple product sub-categories, with the stack length indicating the total sales for each product sub-category. Setting the Split by option to Ship Mode displays the number of items shipped by each shipping method for each product sub-category, as well as the average sales for each shipping method. Changing the colors used to display the different shipping methods aids visualization.
For more information, see Data dimensions and metrics.
IMPROVED STUDIO OBJECTS AND EVENTS Versioning and deploying packages to replace publishing workflow
We’ve replaced and upgraded the publishing workflow in Studio and Objects and Events with a new versioning and deployment system, giving you greater control over your content. Initially released in public preview, these features allow you to create and manage package and data models versions, track changes, deploy to development and production environments, and efficiently roll back to previous releases.
Studio: Studio lets you deploy packages and control which versions of packages and assets App end-users can access. With version control and support for multiple package versions, you can test new features and configurations before roll out, and offer different App versions for specific use cases via duplicating the package (e.g., locations, products, or teams).
To learn more, see: Versioning and deploying packages.
Objects and Events: Use versioning and deployment capabilities to create, test, and release numbered versions of your object-centric data models. You can deploy to development or production data pools and review or reload earlier versions at any time.
To learn more, see: Versioning and deploying OCDM.
For a video overview of these features:
January 13, 2026
IMPROVED STUDIO PQL editor added to select Knowledge Model entities
You can now use the PQL editor when creating and editing the following PQL-based Knowledge entities: Auto-generated attributes, calculated attributes, filters, and KPIs.
These improvements make working with PQL queries faster, clearer, and more powerful across the platform. They also bring the following benefits:
Pre-save validation: Calculated attributes are now validated before saving.
Improved readability: Display data appears in the sidebar for quick reference.
Enhanced variables: Easily access and apply enhanced variables during PQL query editing.
Flexible entity creation: No more single-column restrictions when creating new entities.
To learn more about creating Knowledge Models, see Knowledge Models.
And for an overview of the PQL editor, see PQL editor.
IMPROVED STUDIO New Data Label settings panel for charts in Views
We've added a dedicated Data Labels panel that gives you flexible and granular control of data labels in charts. It also provides feature parity with the data label customization options available in Studio Analysis (maintenance mode only).
Previously, data labels could make charts in Views look cluttered and the data labels themselves could be difficult to read. With the flexibility and greater control introduced with the new Data Labels panel, you can now:
Quickly toggle data labels on and off.
Move and rotate data labels to improve their readability.
Change the color of data labels, the color contrast and the text size.
Change the offset of data labels to prevent overlap.
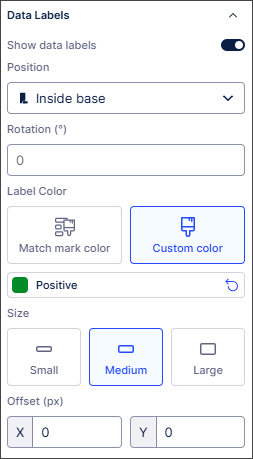 |
For detailed information about the settings available, see Chart data labels.
January 12, 2026
IMPROVED STUDIO Fetch current user information with smart inputs
We've added a new smart input command. This lets you fetch information about the current user like their name, email address and role.
For more information, see Fetching current user information with smart inputs.
PRIVATE STUDIO Analysis to View migration extended to bookmarked filters
With this Private Preview release, you can now migrate bookmarked filters from Analyses to Views.
Previously, bookmarked filters used in Analyses had to be manually recreated from scratch in Views, resulting in additional work for users.
Admin and analyst users with edit permissions can now migrate bookmarked filters as required during the Analysis to View migration and select whether to migrate all bookmarked filters or shared bookmarked filters only.
Once migrated, the bookmarked filter type and owner are respected in the View and shared with the same users in the View as in the original Analysis.
For more information, see Migrating bookmarked filters to Views.
And for more information about our private preview releases, see Feature release types.
IMPROVED DATA INTEGRATION Extractor Builder now supports multiple dependency columns
You can now define multiple dependency columns within Extractor Builder custom configurations, which enables more sophisticated data extractions from your source systems. By setting multiple columns in your dependency configuration, the Extractor Builder automatically generates placeholders for each that you can use in your endpoint configuration to reference its value. This allows you to inject multiple values into a single request for precise data retrieval tailored to more complex use cases.
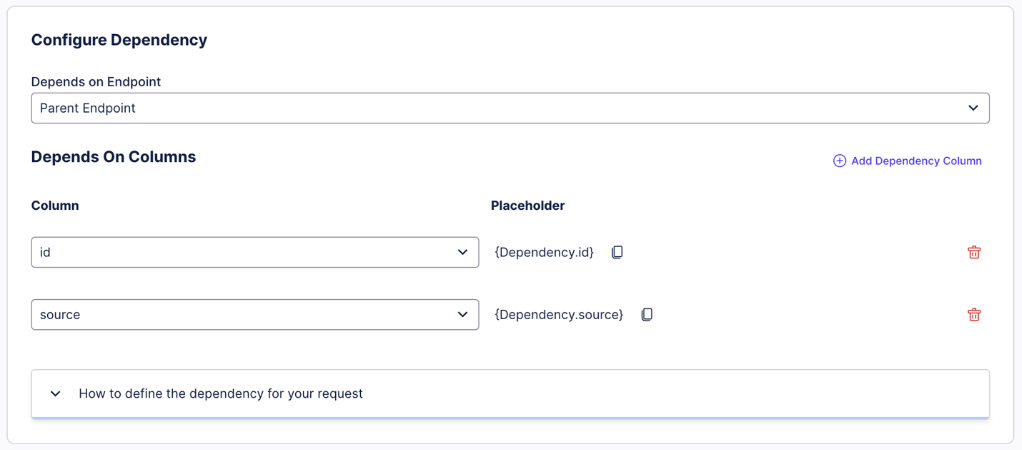
Additionally, this enhancement provides the architectural flexibility required from advanced source systems and APIs that require multi-layered requests. By being able to handle multiple dependency values, platforms that require composite keys or multiple filtering parameters to access data can also now be supported. This helps ensure a more robust and scalable integration process that keeps pace with your data landscape.
For more information on custom Extractor Building configurations, see Extractor Builder.
January 9, 2026
IMPROVED STUDIO Migrate legacy Views using the migration wizard
You can now migrate your legacy Views using the new migration wizard. In addition to migrating individual View components, you can choose between a fast-track migration or a custom migration:
Default / Fast track migration: Automatically migrates your Legacy View and supported features using default settings.
Custom / Step-by-step migration: Lets you choose which connected views, components, and variables to migrate.
Legacy Views are views created using the pre–May 2024 Studio feature set (previously known as the general availability feature set). While you can still use Legacy Views in Studio, they're no longer being developed or enhanced. We therefore recommend migrating your Legacy Views to the current Views feature to take advantage of the latest updates and improvements.
To learn how to migrate your legacy Views to Views, see Migrating Legacy Views to Views.
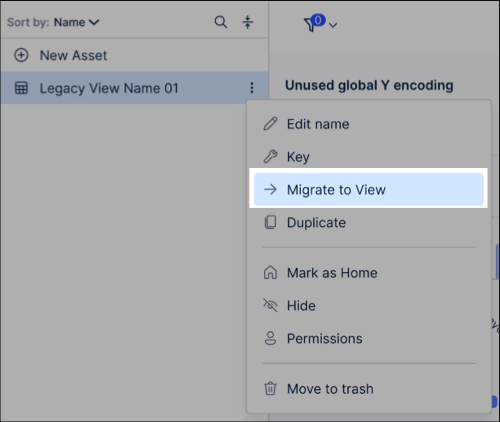
January 8, 2026
IMPROVED MACHINE LEARNING PyCelonis MLWB Read/Write Access to Augmented Attributes
PyCelonis has been updated to allow Machine Learning Workbench (MLWB) scripts to directly read from and write data to augmented attributes. Previously, interacting with augmented attributes required complex workarounds or was not supported directly. Changes made to data via ML/AI models are now directly and immediately reflected in frontend applications built in Celonis Studio and Views.
Data Scientists and Analysts can now build ML pipelines that directly drive operational applications. Instead of just analyzing data, their scripts can write predictions or classifications back to the data model that instantly update the Studio/Views interfaces used by business stakeholders.
Users must update their PyCelonis package to the latest version to access this capability. For more information, refer to the documentation: PyCelonis - PyCelonis.
IMPROVED STUDIO View filter enhancements
We've made some changes to filters in Studio Views to help simplify and enhance their use.
Built-in (attribute and process) filters are now available in edit mode in addition to view and interactive modes. This lets you create and apply complex filters without writing PQL statements or switching between Studio modes. For more information, see Filtering Studio Views.
You can also now view the underlying PQL statements used to implement View filters in Edit mode. Copying and editing these PQL statements means you don't need to create your own filters from scratch. You can also save your filters to the Knowledge Model as global filters. To find out more, see Viewing and reusing filter PQL statements.
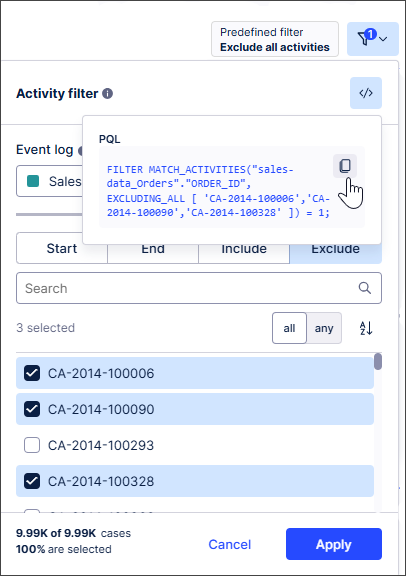 |
We've also made attribute filters more user friendly. You can select which attributes can be selected by business users, helping ensure only relevant options and data are displayed. For more information, see Attribute filters.
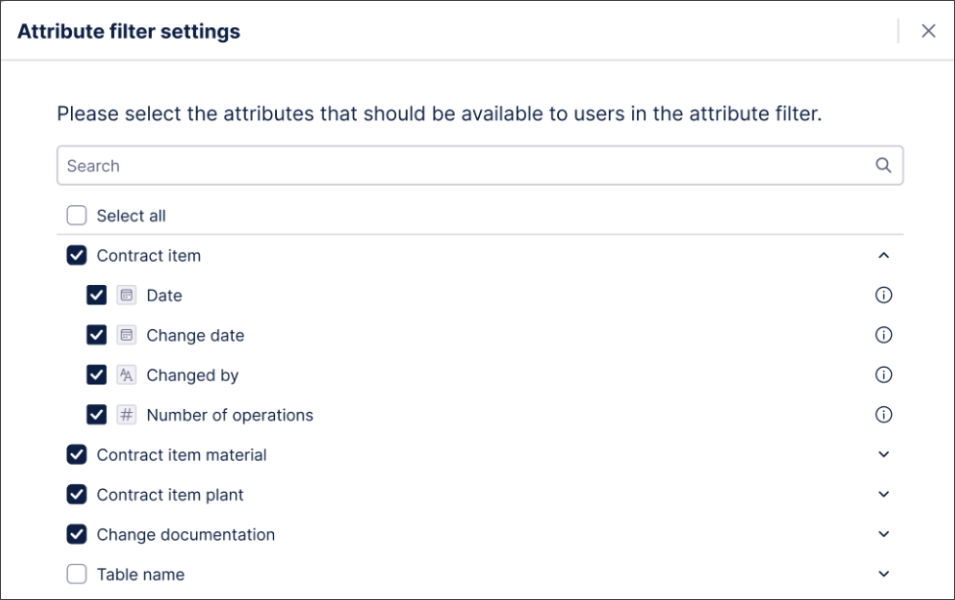 |
We've also improved syncing between process filters and View components. You'll get a notification if an event log is:
Automatically selected in the process filter settings when a View component is configured with an event log.
Removed from a View component.
You can then review and edit your process filter settings if required. For more information, see Process filters.
We've also aligned container components with other components so they can be now excluded from filtering. For more information, see Containers / Conditional layouts.