2. display_chart — Display Chart
Mode: Both · Category: Data Visualization
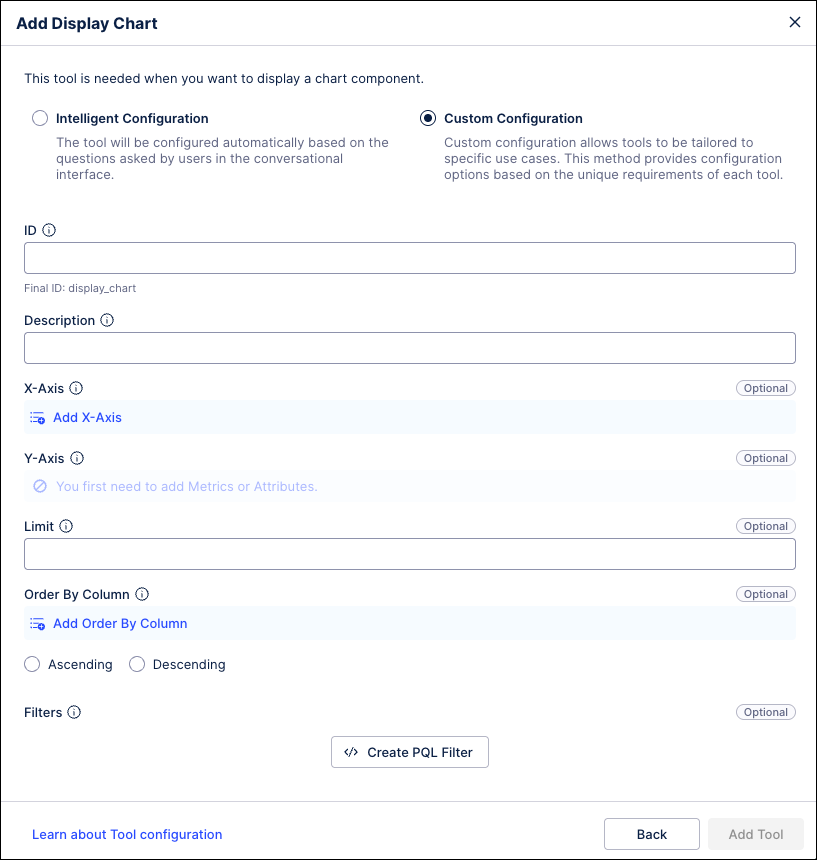
Displays a chart visualization in the frontend. You can pre-fill any subset of the fields below and the LLM populates the rest at runtime.
- id: display_chart
- id: display_chart
  x_axis_id: INVOICE.INVOICE_VENDOR_NAME
  y_axis_id:
- KPI_INVOICE_COUNT- id: display_chart
x_axis_id: INVOICE.INVOICE_VENDOR_NAME
y_axis_id:
- KPI_INVOICE_COUNT
chart_type:
- bar
limit: 10
order_by: KPI_INVOICE_COUNT
ascending: false- id: display_chart
x_axis_id: INVOICE.INVOICE_MONTH
y_axis_id:
- KPI_INVOICE_COUNT
- KPI_TOTAL_INVOICE_VALUE
chart_type:
- bar
- line
Any field you set is fixed. Any field you omit is decided by the LLM.
 |
Field | Type | Description |
|---|---|---|
| string | Record attribute ID for the x-axis. |
| list[string] | KPI IDs for the y-axis (max 2). |
| list[string] | Chart types per y-axis (e.g., bar, line; max 2). |
| int | Max number of rows for the chart data query. |
| string | Column ID to sort by (must be one of the x/y-axis IDs). |
| bool | Sort direction. |