Creating applications and dashboards using Studio
Studio is a low-code development feature where you can build, test, publish, and share process-focused applications (apps) and dashboards. Using data ingested from your process ecosystems, you can then use this content to view real-time insights and recommendations for your business.
When using Studio, you should understand the following key concepts:
The following example is a bench marking view from a Process Cockpit application, created using Studio Views:
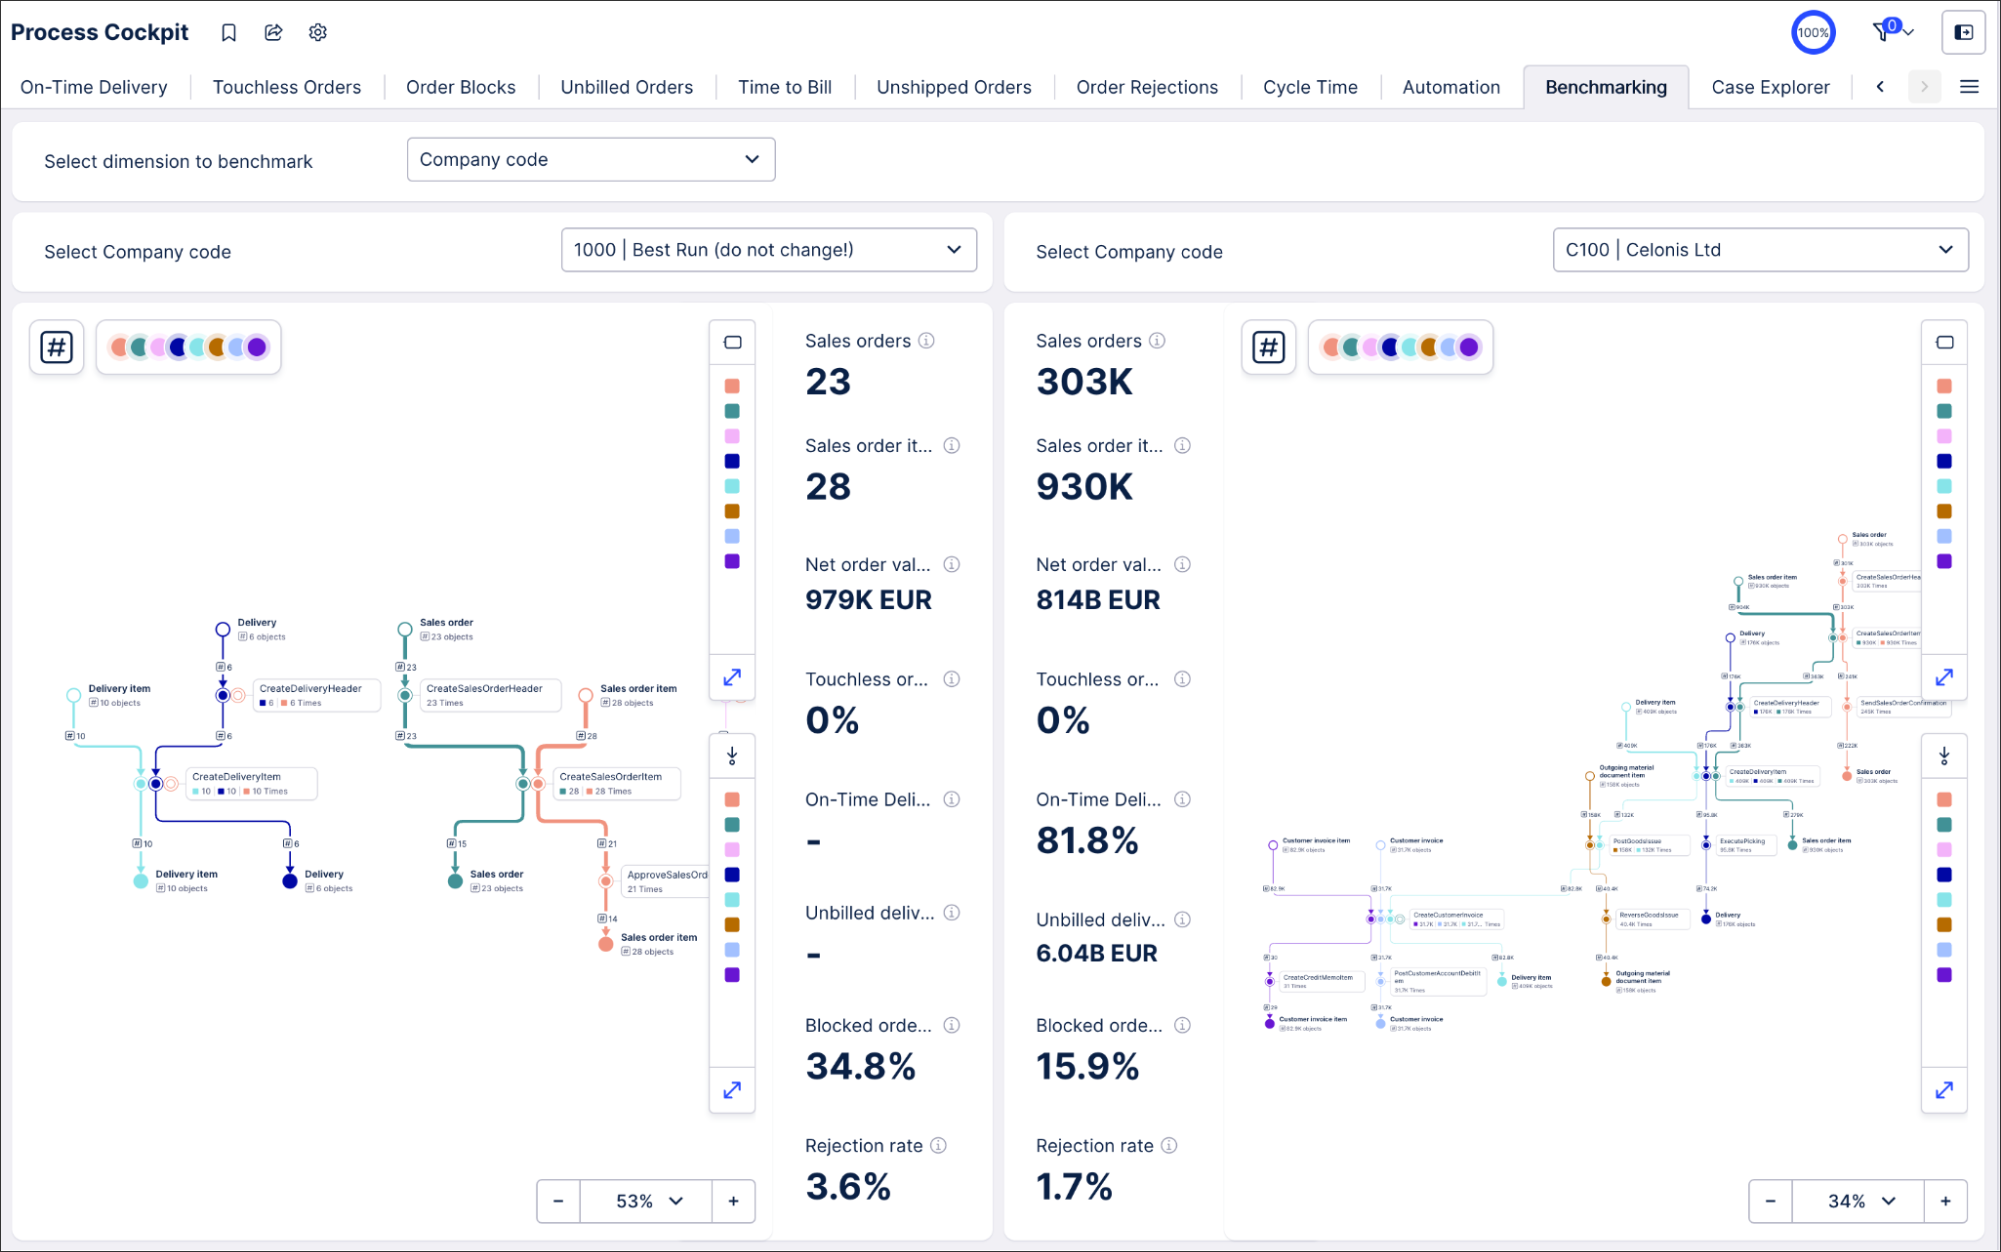 |
To allow you to build dashboards and apps within Studio, your data engineers have connected your process ecosystems (such as your ERP) to your Celonis team using the Data Integration feature. The raw data from these connected ecosystems is then ingested and transformed into what we call Data Models (which show a picture of how your systems are connected). You can then use these models when creating your Studio content.
Then in Studio you create Views and apps by selecting the data you want to display on your dashboard and then choose the layout, filters, and related settings for it. This dashboard can then be tested, published with version controls, and then shared with your colleagues. You can also take advantage of the automation and simulation tools available in Studio, helping you to automate repetitive tasks and simulate processes to assess the impact of decisions beforehand.
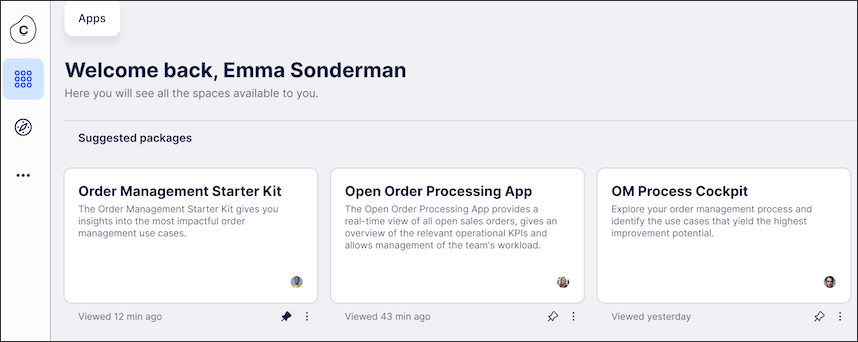
The dashboard and apps you created and shared within Studio can then be viewed by you and your colleagues in the Apps area.
To learn more about Studio workflows, see: Workflow and content structure.
 |
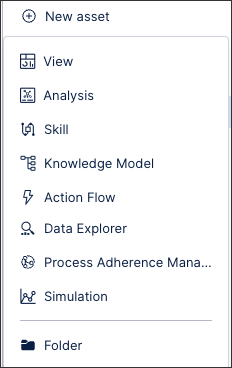
When creating content in Studio, you have a number of asset types to choose from. Each asset provides different business focused functionality, helping you to efficiently create applications.
View: Views are a package asset type that allow you to visually display your data within an app, giving app users an interactive dashboard to engage with. Views can be created using a drag and drop grid-based canvas, where you can visually place, size, and configure View components. This interface also includes features that helps you to build screen-fit Views, organize your data into tabs, and undo/redo when needed.
See: Views.
Analysis: Creating an Analysis helps you to identify execution gaps in your business processes. Using this asset, you can create a custom visualization of your as-is process and analyze the underlying data.
See: Analysis.
Action Flow: Action Flows are an automation asset and allow you to integrate real-time process intelligence with targeted action to fix inefficiencies faster and more effectively.
See: Action Flows.
Knowledge Model: A Knowledge Model is the central place to store and share business knowledge within a Studio app. As part of a package, a Knowledge Model stores reusable business entity definitions such as KPIs, metrics, filters, and variables.
See: Knowledge Models.
Skills: Skills are a key automation feature, allowing you to automate and execute repetitive tasks as part of a wider business process.
Process Adherence Manager: Process Adherence Manager uses your Celonis Platform data to identify any deviations between your actual process and an ideal target process. Process Adherence Manager lets you analyze these deviations and determine their impact on process performance. By determining the root causes of deviations, Process Adherence Manager also helps you understand where and how you can improve your process.
Simulation: Process Simulation allows you to measure the impact of potential changes on your processes and the effect they would have on your operations. You can simulate any part of the process and, thereby, assess the impact of decisions beforehand.
See: Process Simulation.
Data Explorer: Data Explorer enables you to easily validate your data and quickly build PQL queries.
See: Data Explorer.
AI Annotation Builder: The Annotation Builder is an AI-enhanced asset that enriches the data in the Process Intelligence Graph (PIG) using Large Language Models (LLMs) to interpret the data and process it using natural language guidelines like a human. This allows you to then leverage your LLMs to act as intelligent assistants. An Annotation Builder processes and interprets your data, applies reason to the data, and makes informed decisions based on the instructions provided.
See: Annotation Builder.
Insight Explorer: Insight Explorer is an AI-powered interface that automatically uncovers insights for any metric within your data. After choosing the relevant metrics and attributes from your Knowledge Model, you can generate a structured list of insights to explore. You can review each insight and choose to mark insights for further analysis or hide insights based on their potential value.
See: Insight Explorer.
Process Copilot: Process Copilots are AI-powered conversational assistants that allow you to interact conversationally with your Celonis data: asking questions, building graphs, looking for insights or viewing process flows. Using Process Copilots, you can analyze your data by asking natural language questions or using the predefined prompts to get your response in a variety of formats.
See: Process Copilots.
To learn more about Studio asset types, head to: Asset types.
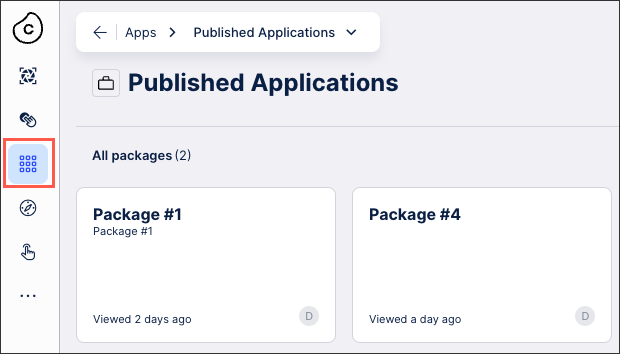
Once a package has been published, it can be viewed as an App by team members with the necessary viewing permissions. This allows them to interact with the app, taking advantage of the Views and related features that you've created.
To find out more about viewing your Studio content within Apps, see: Using Apps.
 |