Analysis Components
Analysis - Maintenance only
Effective August 1st 2025, Analysis features can no longer be purchased as part of a Celonis Platform license. Celonis continues to maintain Analysis (by fixing bugs and ensuring that performance remains strong) but no further feature development will take place.
You can migrate your existing Analysis assets to our enhanced Studio Views, giving you access to our intuitive View creation capabilities. To learn how to migrate your existing Analysis to Studio Views, head to: Migrating Analysis to Views.
And for an overview of our enhanced Studio features, see: Studio feature availability matrix.
Components in Celonis Analyses allow you to visualize your process data or build up your analysis.
Celonis has five different categories of components, as described below. Specific important and new components are described on a specific page with examples and detailed description of the functionalities
Process Components: Visualize your activities and the way processes flow through them (Process Explorer and Variant Explorer).
Charts and Tables: Plot you data or group, segment and arrange them in tables (OLAP Table, Pivot Table, World map,)
Single KPI Components: Track your data according to a single KPI.
Selection Components: Helps the user create selections.
Design Components: Create design elements for your analysis.
Create Components
Note
You have to be in edit mode to add new components.
New Component Section
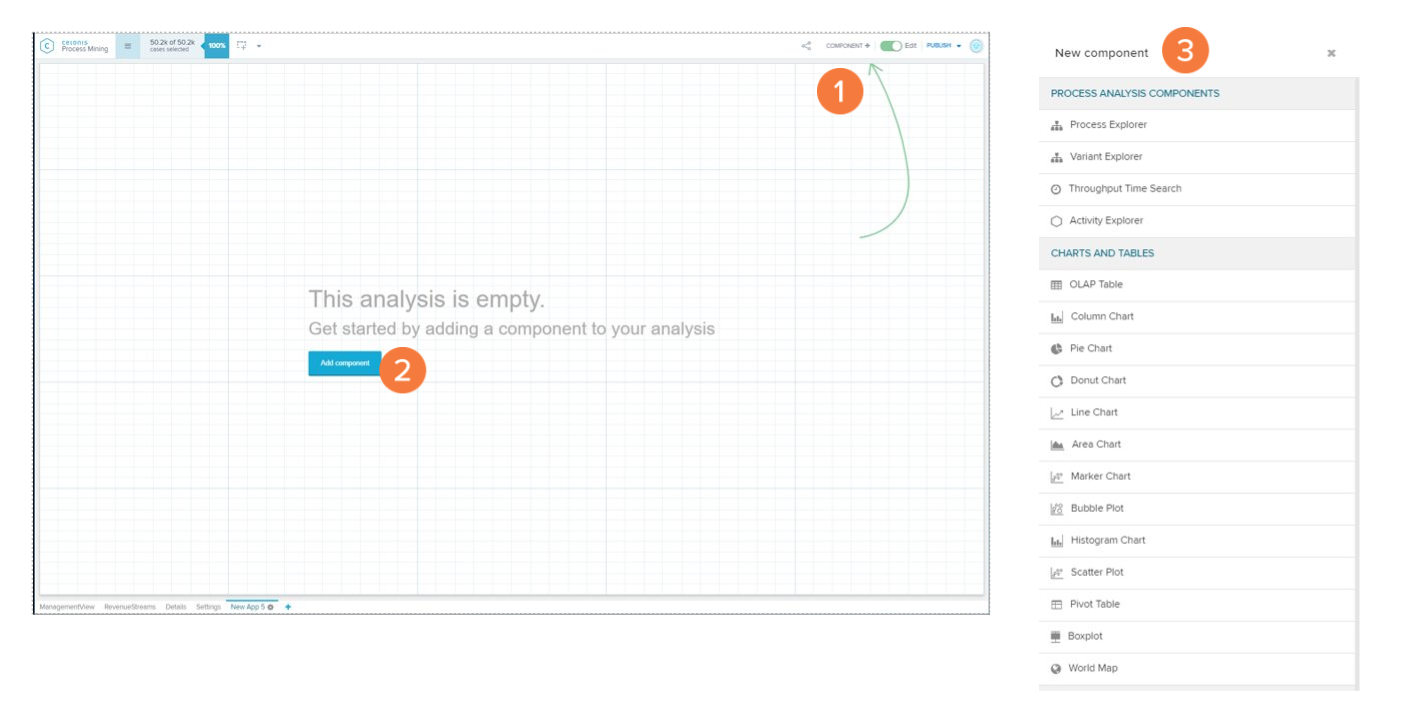
You can create a new component with the:
Component+ button at the top right.
Add component button on empty sheets.
Note
The new component section provides access to all analyses components for the Celonis analyses.
Add Component
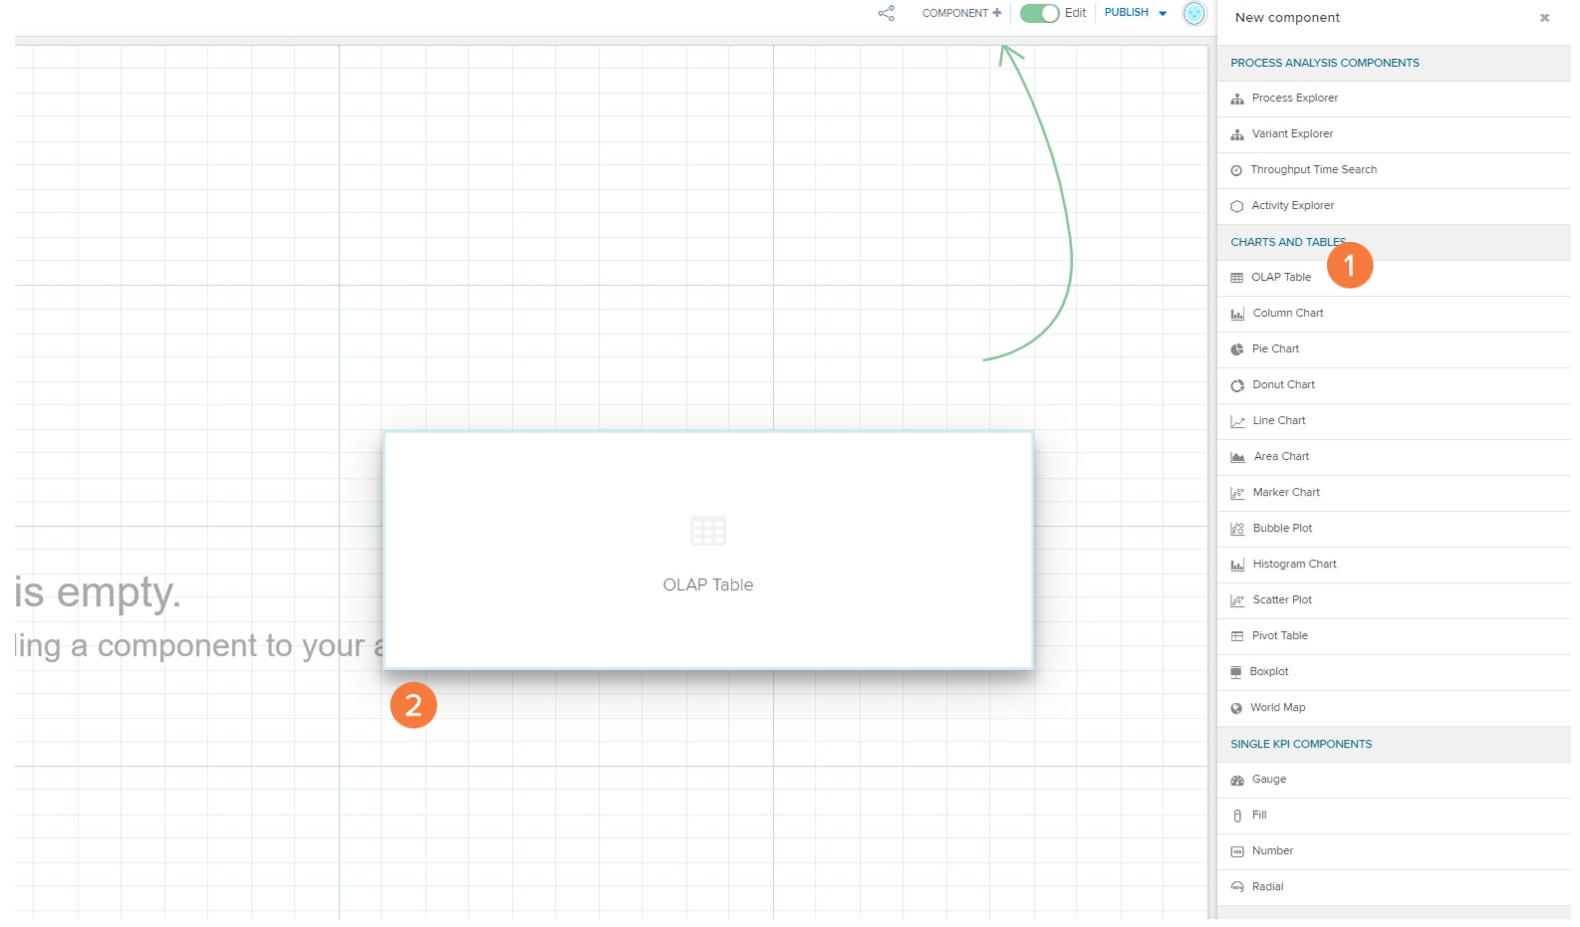
To add a component to a Analysis Sheet:
Click one of the components in the New Component Section.
Drag and drop it to the Canvas.
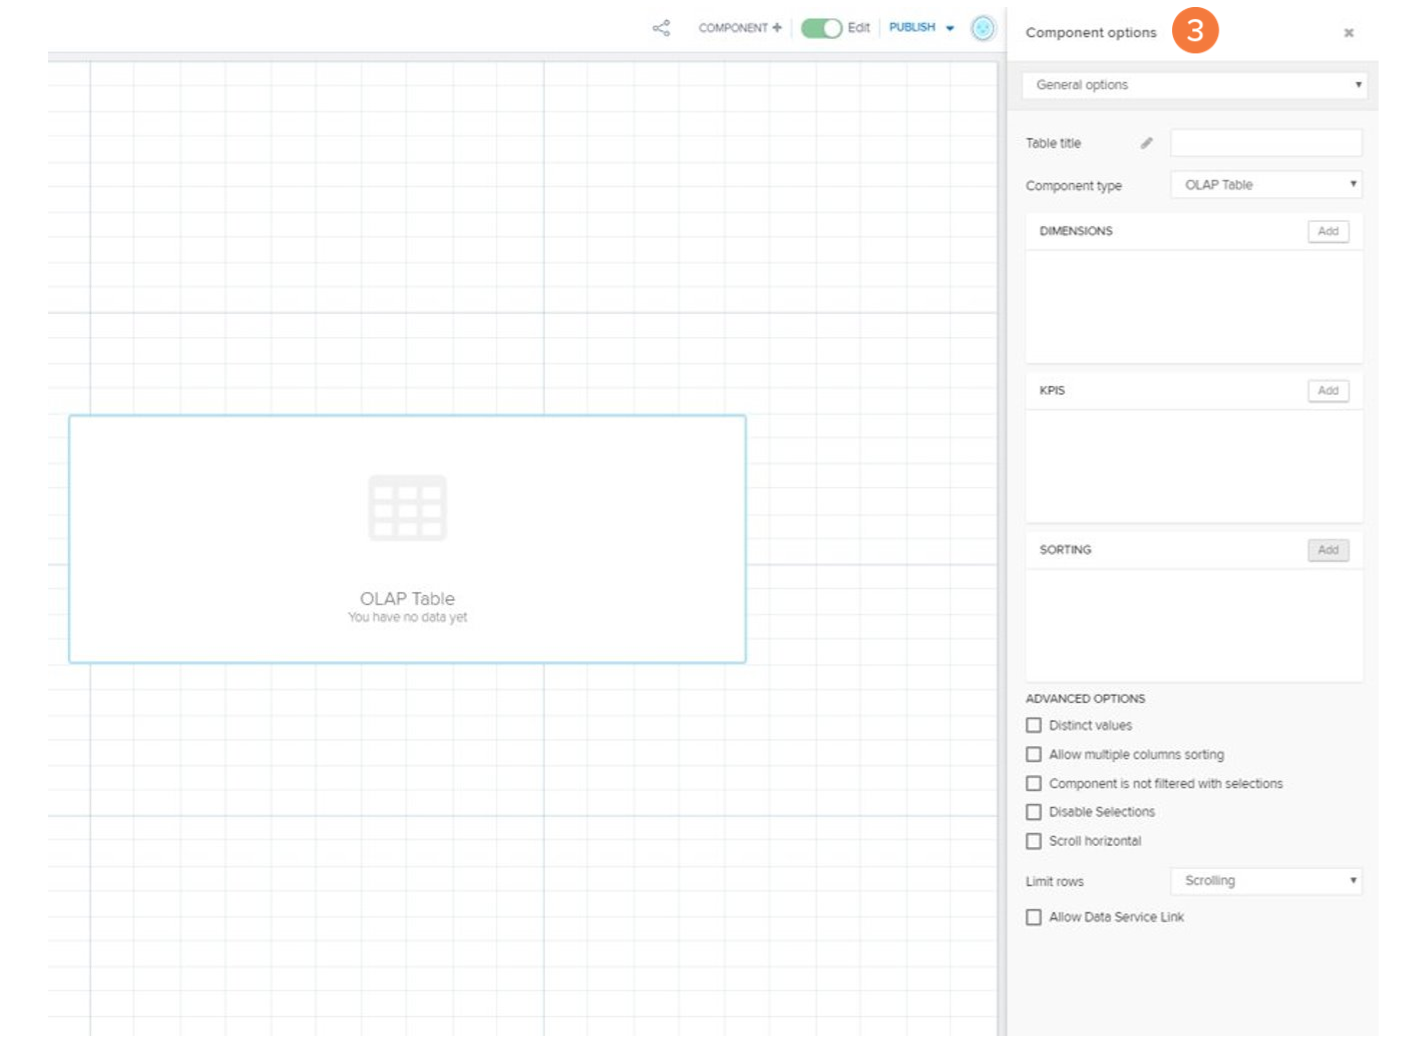
The component will be added to the sheet in its default setting and you can use the component options to define which data is shown to you.