Process Simulation results
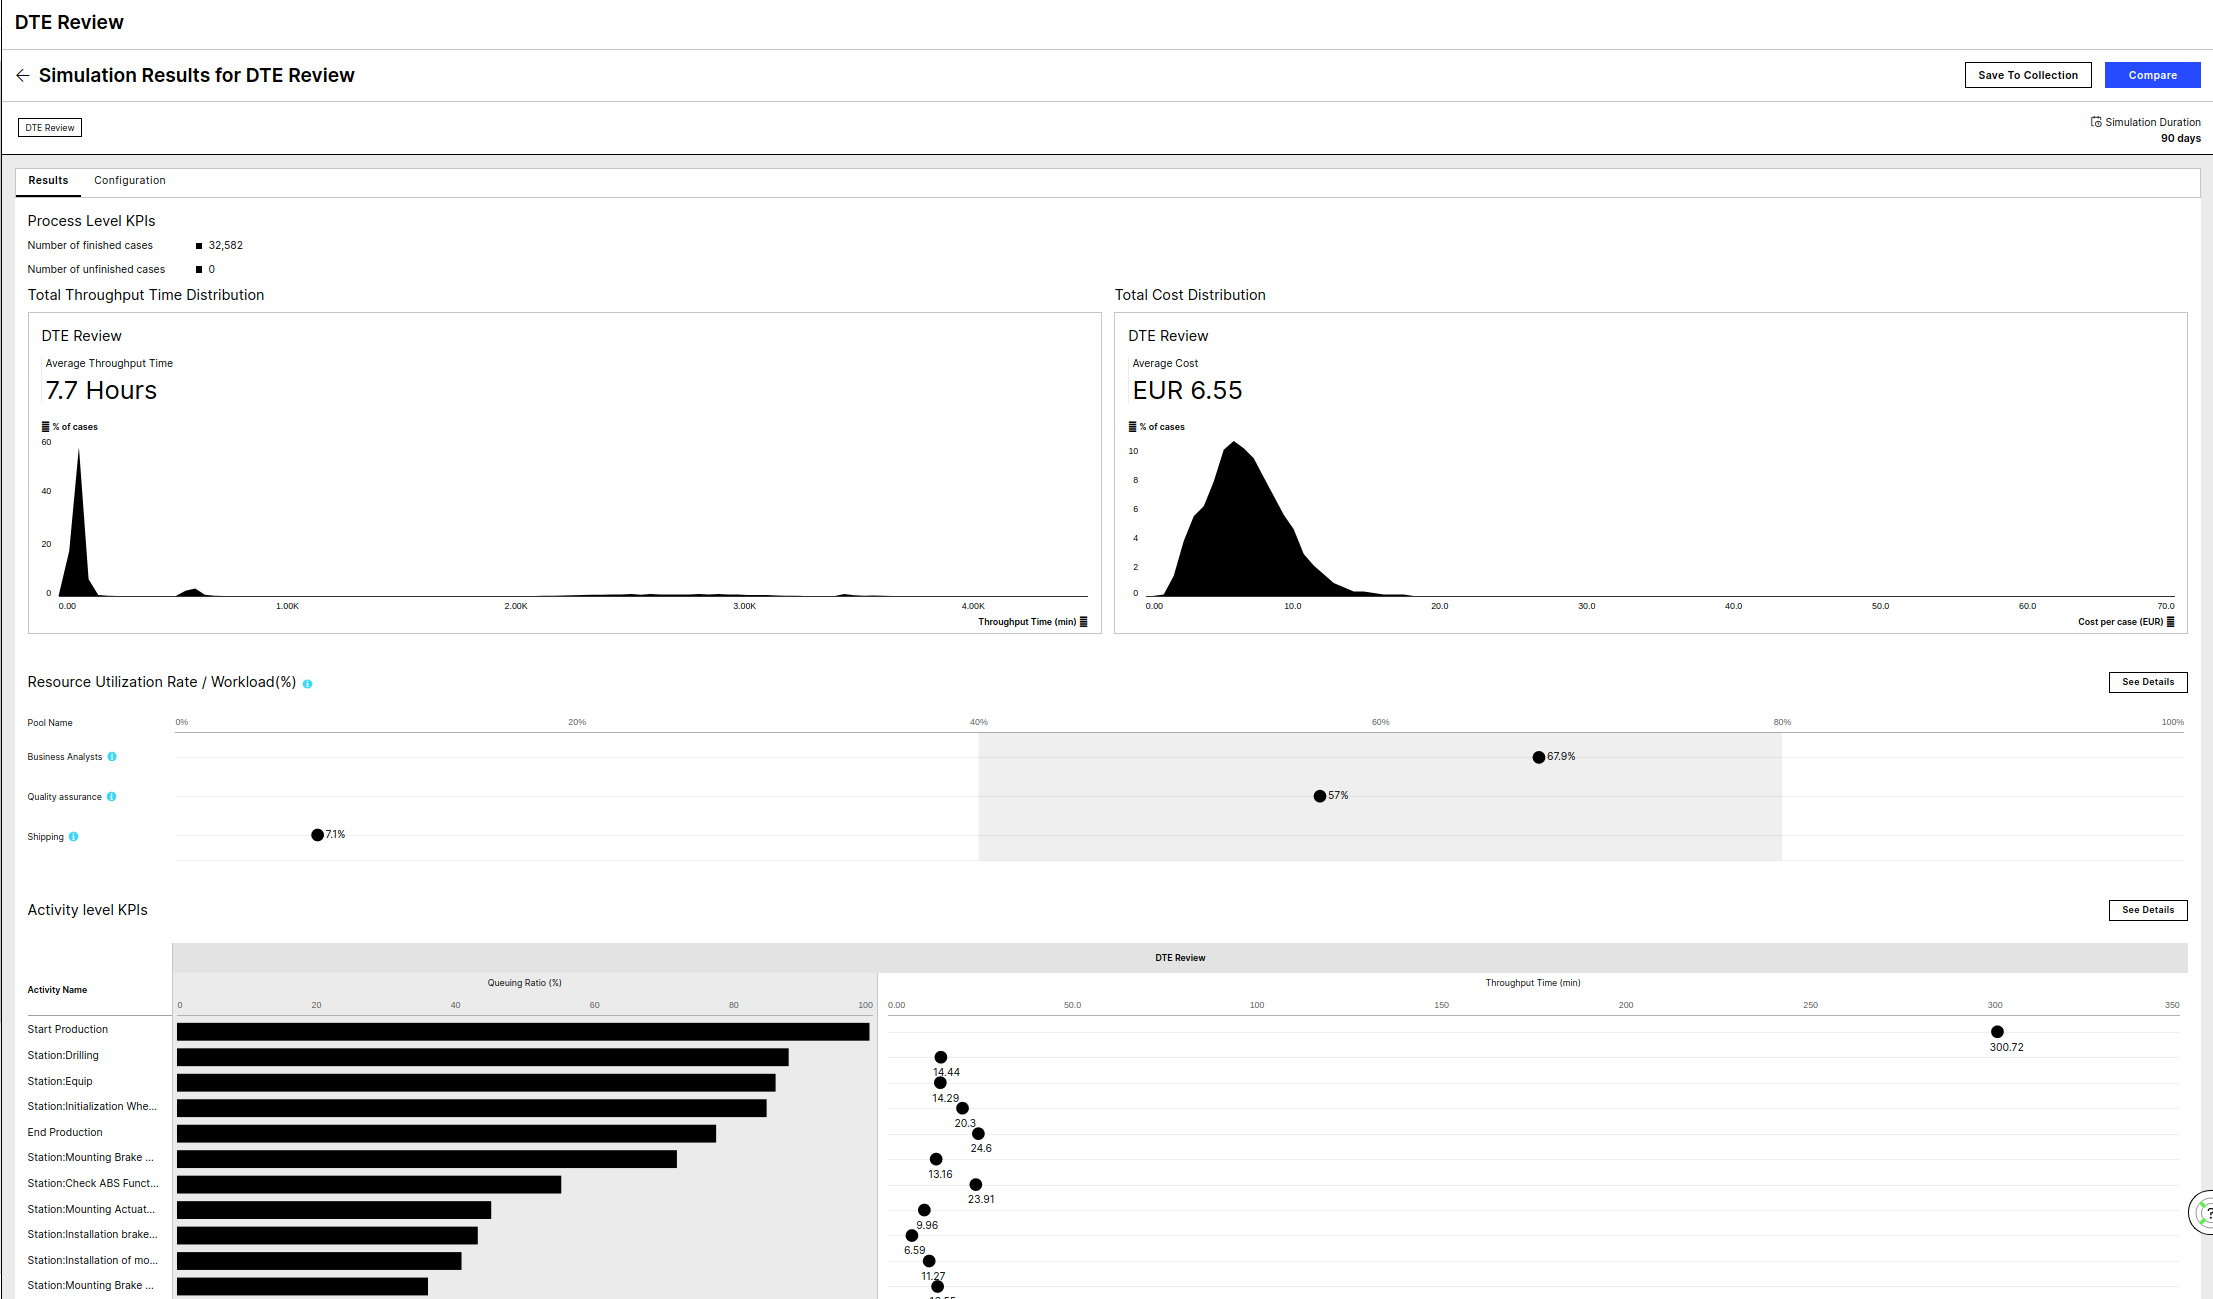
When opening the Results view there are three groups of KPIs to recognise. The Process, the Pool and the Activity level KPIs.
 |
Results
Process
On top are the Process level KPIs to be seen consisting of the number of finished and unfinished cases, the average Throughput Time and the average cost.
Pool
The Resource Pool level KPIs follow with the Utilization Rate, the total Processing Time and the the total Processing Time per case, all aggregated per Resource Pool.
Activity
At last the Activity KPIs consist of the Queuing ratio, the Throughput Time, the Total Processing Time per Activity and the Number of Occurencies.