Inventory Management Apps
Unprecedented supply shortages and demand volatility call for a new approach to supply chain and inventory management. Our Inventory Management apps help you to improve material availability, reduce operating costs, and free up working capital, by analyzing the downstream impact of material movements in real time and taking action based on true consumption and replenishment patterns.
Inventory Management Core Concepts
The Inventory Management apps enable you to monitor operations and track value realization based on built-in KPIs, inefficiencies, and inventory classifications. Here’s the core concepts we use to make our recommendations. We make each calculation for a combination of material and plant.
- Inventory on Hand
The sum total of current inventory at the time of the last data load.
- Purchase Lead Time
The time between the event of creating a purchase order, and the timestamp when the last goods receipt was assigned to it.
- Production Lead Time
The time between a production order's production start date, and the production finish date assigned to it.
- Reorder Point
The minimum amount of an item to hold in stock, such that when the stock falls to this amount, the item must be reordered. In the Inventory Management Master Data Improvement app, we calculate this using the recommended safety stock level, the actual purchase or production lead time, and the average daily consumption. In the other Inventory Management apps, we use the value from the source system.
- Untouched Stock
The minimum stock level that has never been undercut in the last 2 years. A combination of material and plant is flagged for untouched stock if this value is greater than zero and the overall inventory on hand is above the safety stock, unless the inventory on hand is lower than current open sales orders (so every unit on hand is technically already sold).
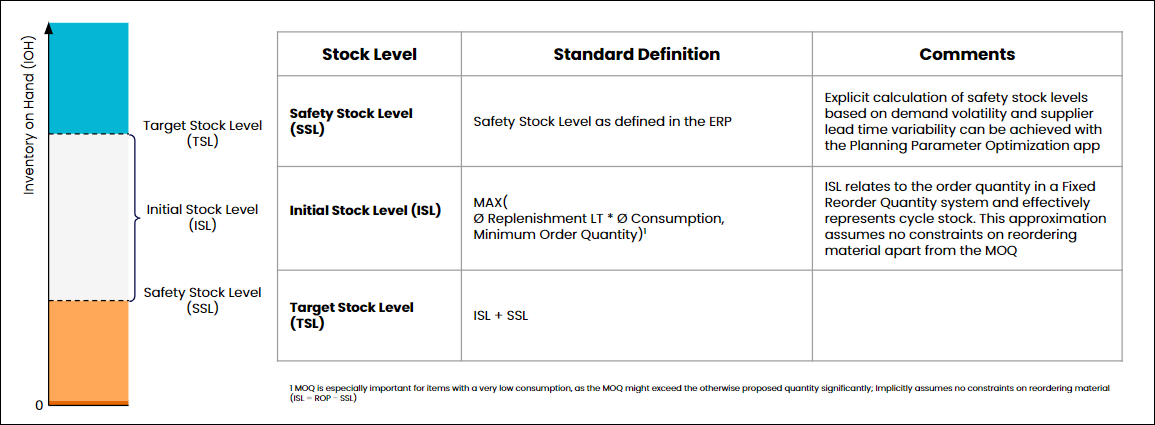
- Initial Stock Level
The larger of the minimum lot size (minimum order quantity), and the average replenishment lead time multiplied by the average consumption per day (over the last 24 months). To address fluctuations in demand patterns, we average the historic consumption over the past 12 months. In our object-centric apps Supply Chain Network Visibility, Material Allocation, and Planning Parameter Optimization, we also include the projected demand for the upcoming 3 months, leveraging our inventory projection. You can adjust these timeframes using Knowledge Model variables.
- Safety Stock Level
An additional quantity of a material held in the inventory to reduce the risk that the material will be out of stock. Safety stock acts as a buffer in case sales are greater than planned or the supplier is unable to deliver the additional units at the expected time. In the Inventory Management Planning Parameter Optimization app, we calculate a recommendation for the safety stock level using King’s formula. In the other Inventory Management apps, we use the value from the source system.
- Target Stock Level
The sum of the safety stock level as set in the master data, and our calculated initial stock level. The unit for target stock is your SKU (stock keeping unit).
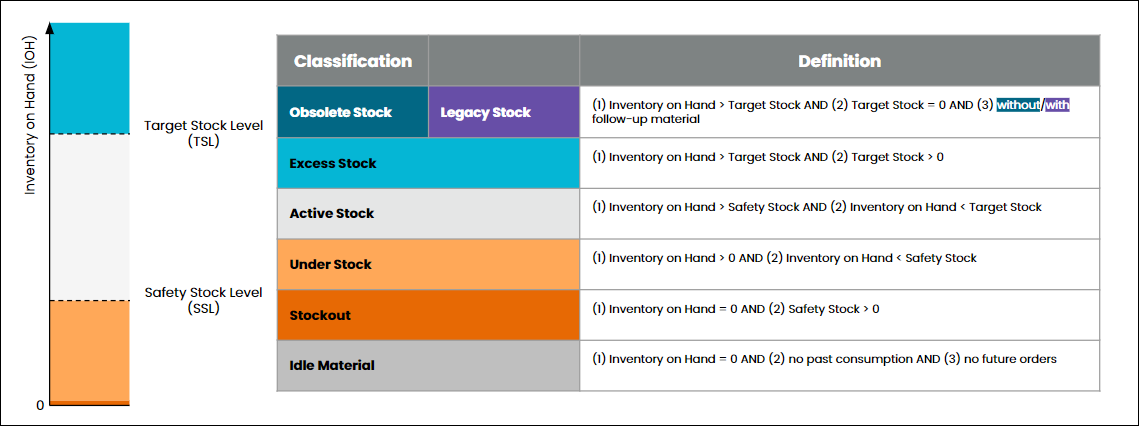
Inventory Classification
All material-plant combinations are assigned to a distinct Inventory Classification. This classification is mainly driven by the target stock level, which is based on demand patterns as described above. We assign each material-plant combination to one of seven mutually exclusive demand-based classifications: Active Stock, Excess Stock, Obsolete Stock, Legacy Stock, Under Stock, Out of Stock, or Idle Material. If we can’t classify a material-plant combination, it’s marked as Unclassified.
 |
- Active Stock
This classification is the ideal situation, where stock is available, and the quantity of stock is greater than the safety stock level, but does not exceed the target stock level. We calculate active stock using the ratio between target stock and actual stock. When the ratio is greater than 1, it means that there is less actual stock than the target stock level. In this case, active stock equals inventory on hand. The unit for target stock is your SKU (stock keeping unit).
- Excess Stock
This condition, also known as Overstock, means that the current inventory on hand exceeds the target stock level. We use the excess inventory rate to quantify the level of excess. The excess inventory rate is computed by subtracting the ratio of active to total stock from 1. If an SKU is classified as excess stock, its excess inventory rate is greater than 0% and smaller than 100%.
- Obsolete Stock
This condition means that the excess inventory rate is 100% and there is no open demand from reservations, sales orders, or independent requirements. An SKU is also considered obsolete, and assigned to this classification, if there is a discontinuation of deletion indicator in place. SKUs in obsolete stock don’t have a follow-up material defined.
- Legacy Stock
This classification means that the SKU has an excess inventory rate of 100%, but it has a valid follow-up material defined.
- Under Stock
This condition means either that the current inventory on hand is greater than zero, but smaller than the current safety stock.
- Out of Stock
This condition, also known as Stockout, means that the current inventory on hand and consignment stock are both zero, while the current safety stock is greater than zero.
- Idle Material
This classification is for SKUs that have no inventory on hand, no consumption in the past 12 months, and no future demand or replenishment orders.
- Unclassified (Valuation Missing)
This label is given to SKUs that can’t be classified because they don’t have a valuation assigned. If you see this label, it usually means there’s a source data issue or a data transformation issue (or both).
- Unclassified (Unknown Reason)
This label is given to SKUs that don’t match any of the categories above. If you see a significant number of SKUs or amount of inventory value attributed to this category, make sure to investigate that while you’re validating the app.
ABC and XYZ Classification
- ABC Classification
An ABC analysis involves applying Pareto's rule on the value of individual materials. The analysis ranks materials according to their value contributions in terms of total consumed value. An ABC analysis is done to classify materials according to their usage value, or number of objects.
During ABC analysis, we assign each combination of material and plant one of these indicators:
A - The most value, or given number of objects that produce the greatest value (80%)
B - Less value, or given number of objects that produce less value (15%)
C - The least value, or given number of objects that produce the least value (5%)
- XYZ Classification
An XYZ analysis is based on the dynamics of consumption. The analysis uses the variance coefficient of consumption or sales in a specific time horizon. An XYZ analysis is done to classify planning objects according to the variance in a specific coefficient.
During XYZ analysis, we assign each object one of the following indicators:
X - Very little variation (<1.0)
Y - Some variation (between 1.0 and 2.0)
Z - The most variation (>2.0)
The ABC and XYZ indicators are combined to classify the material. For example, a material that has the values BY could be a material with medium volume and seasonal demand.