Working with the process model
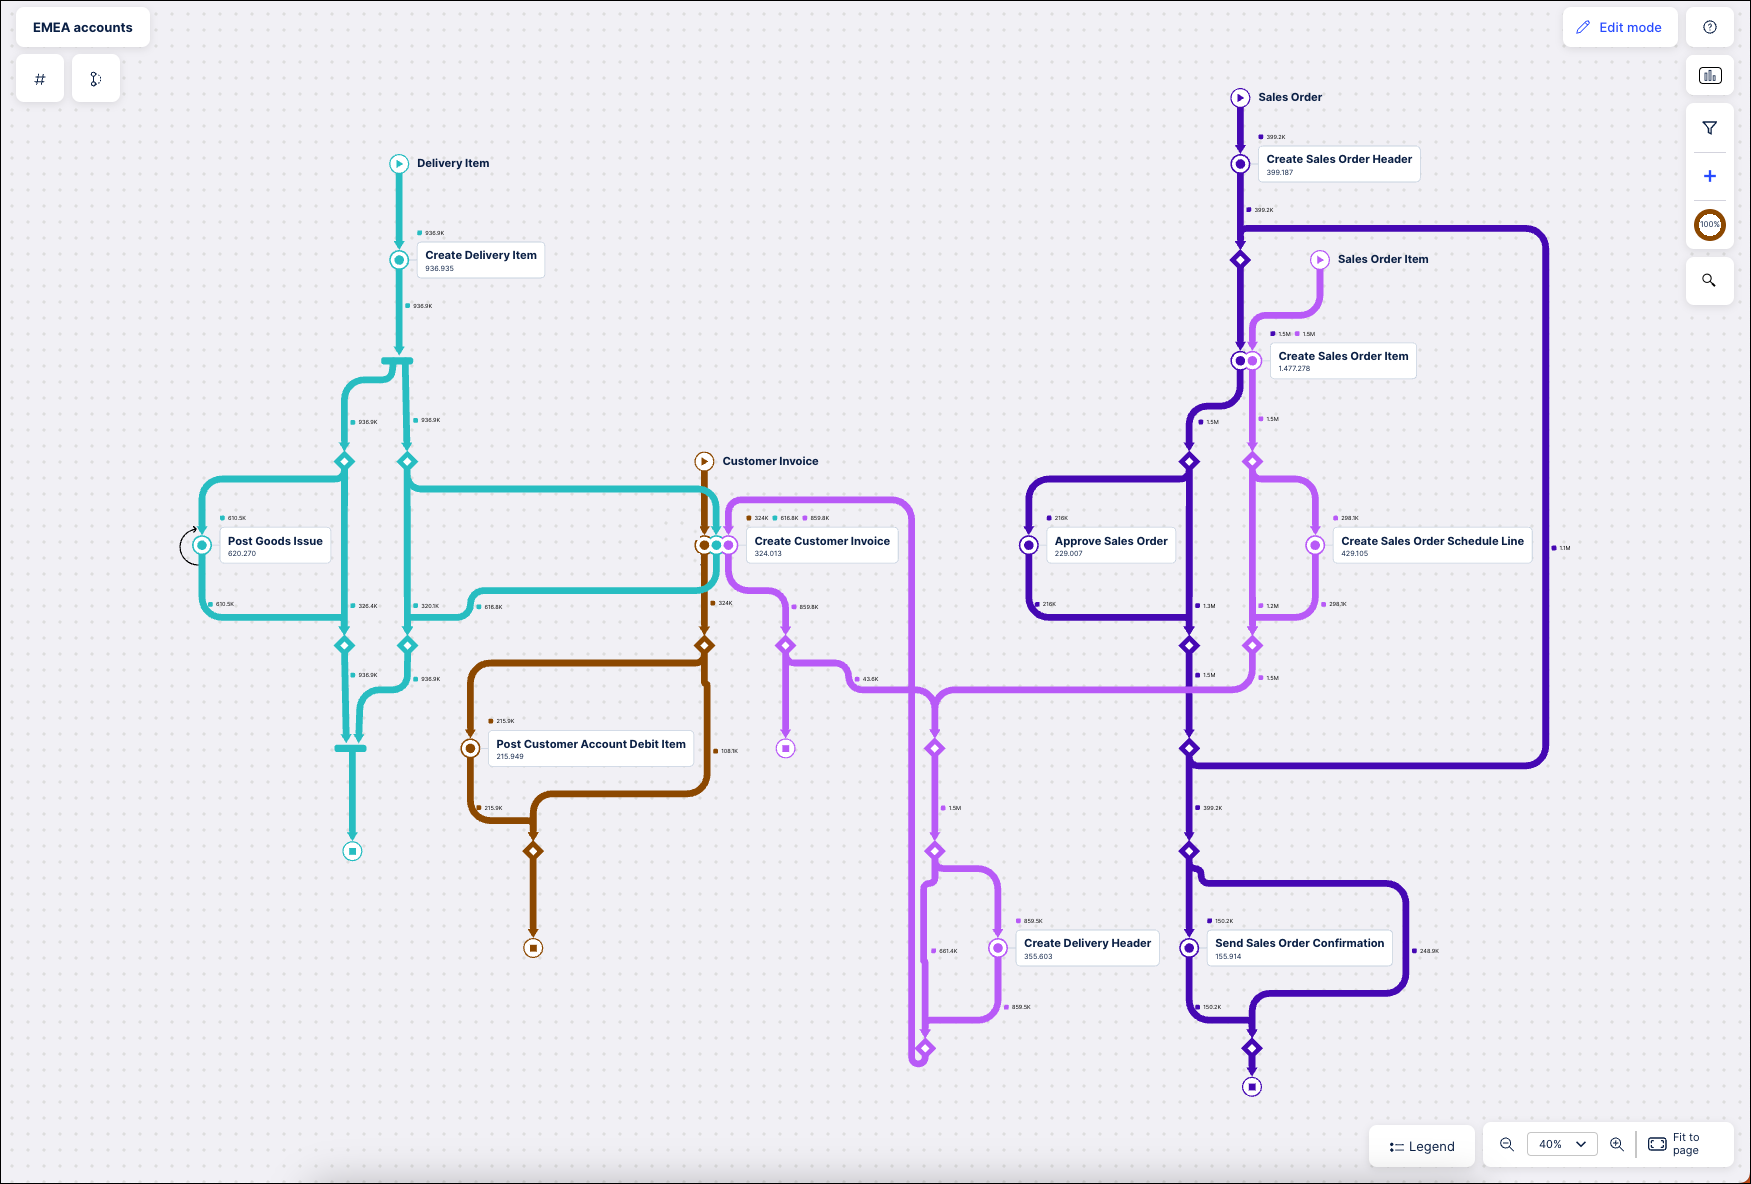
The Process Adherence Manager shows a complete overview of your process model using a layout that resembles a subway map. Each subway line represents a specific event log and is displayed in a different color so you can easily differentiate between them. Each stop on the subway line is a specific event within that process, with multiple lines potentially meeting at the same stop.
The data included in the process model is based on the events selected when creating the model. You can customize the information shown in the model further by applying filters.
 |
Using the map legend
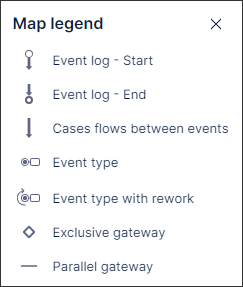
The map legend explains what the different shapes, lines and icons used in the model mean. Click Legend in the lower right corner of Process Adherence Manager to view it.
 |
Event icons in the process model graph
Icon | Name | Description | |
|---|---|---|---|
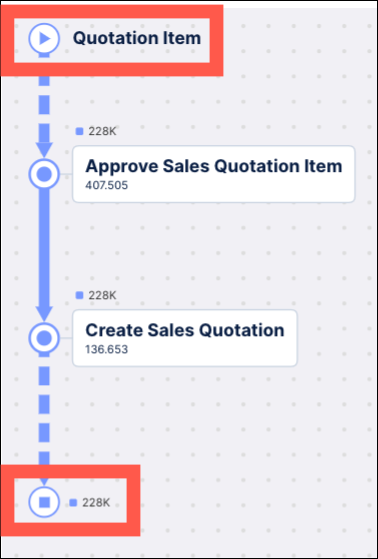
| Event Start/Event End |
| |
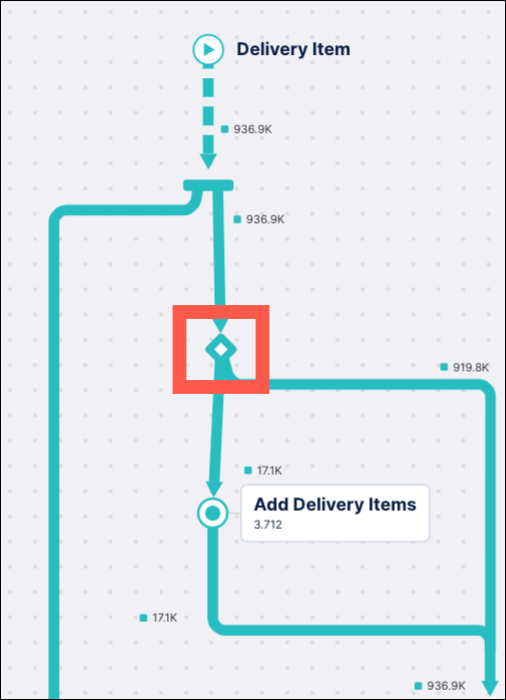
| Exclusive split | The diamond icon indicates an exclusive split of the event flow. This indicates only one of the outgoing paths is taken. | |
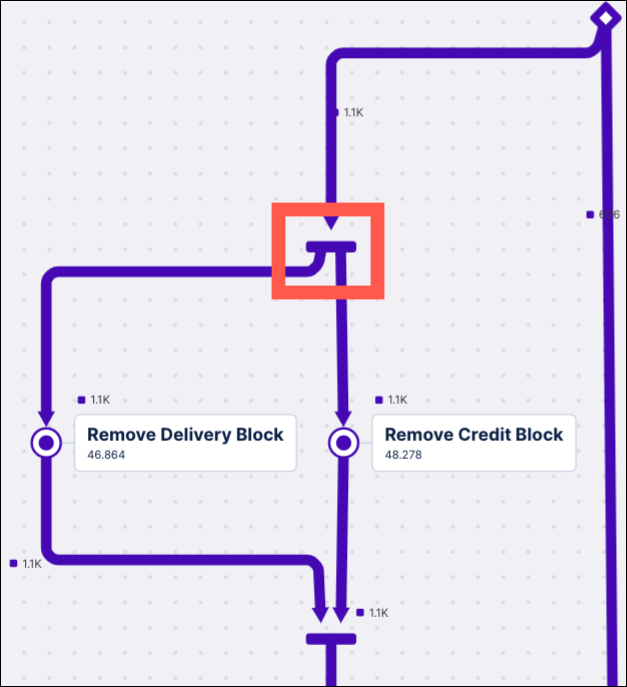
| Parallel Gateway | A horizontal bar (parallel gateway) indicates parallel behavior. All the ongoing paths are taken but their order can differ. All incoming paths join at the gateway before the next events occur. | |
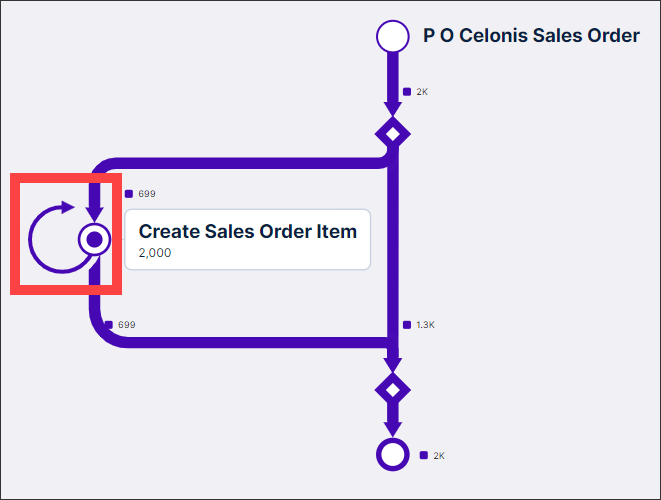 | Self-loop | A looping arrow in an event log indicates a self-loop. The looping arrow has the same color as the event log it occurs in. If a self-loop occurs in multiple event logs, mutiple looping arrows matching the event log colors will display. |