Adherence Explorer
The Adherence Explorer is the final step in creating and analyzing a model with PAM. It's a Studio View component that enables users to analyze deviations in the context of a broader analysis (such as building a dashboard with the conformance rate of a model). It seamlessly interacts with other View components, including charts, tables and Process Explorer.
 |
Before you begin, ensure you have completed the following steps or meet the requirements listed below:
Knowledge model set up in Studio
Process Adherence Manager set to use same Studio package as knowledge model
Analyst role or higher
With the Adherence Explorer you can:
View all deviations and loops at a glance
Build a dashboard of relevant metrics for your organization
Zoom in on specific criteria
To set up Adherence Explorer, follow these steps:
In Studio, create a View from the knowledge model you've set up to use with Process Adherence Manager.
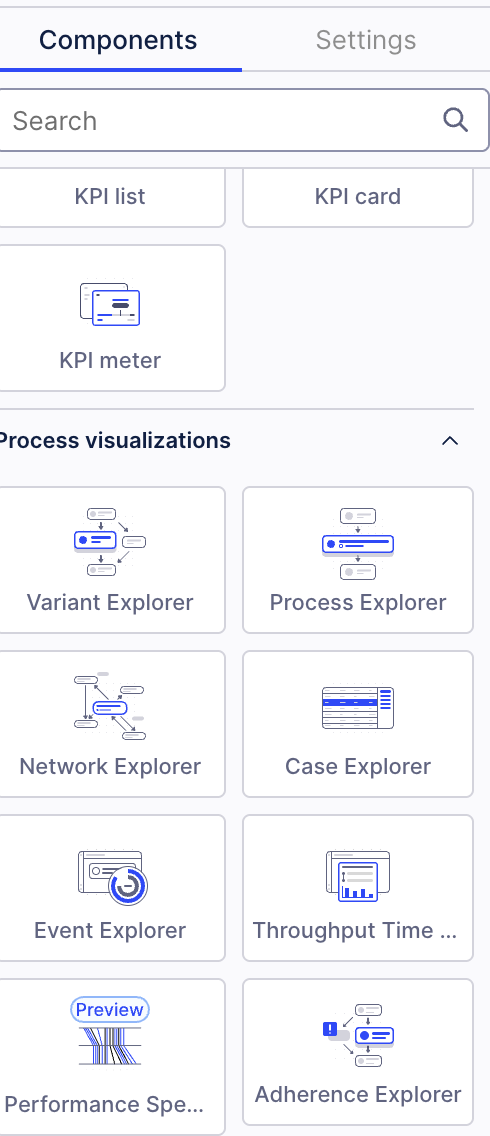
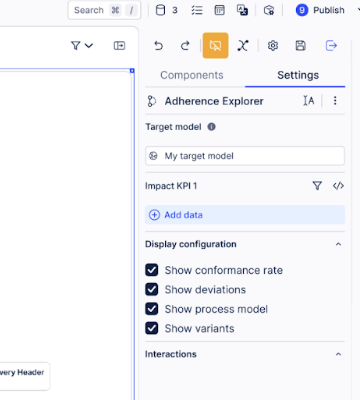
Select Adherence Explorer from the Components menu.
From the right-hand menu, select the target model you created using PAM.
Check the box of each KPI that you want to assess your model against.
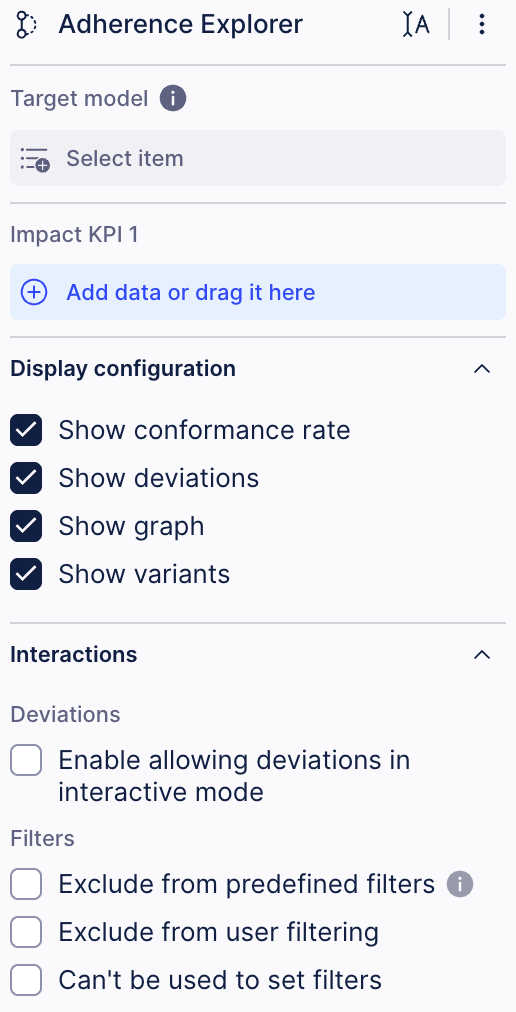
If you want to allow particular deviations, check the Enable allowing deviations in interactive mode box and switch to interactive mode by clicking the button at the top of the menu.
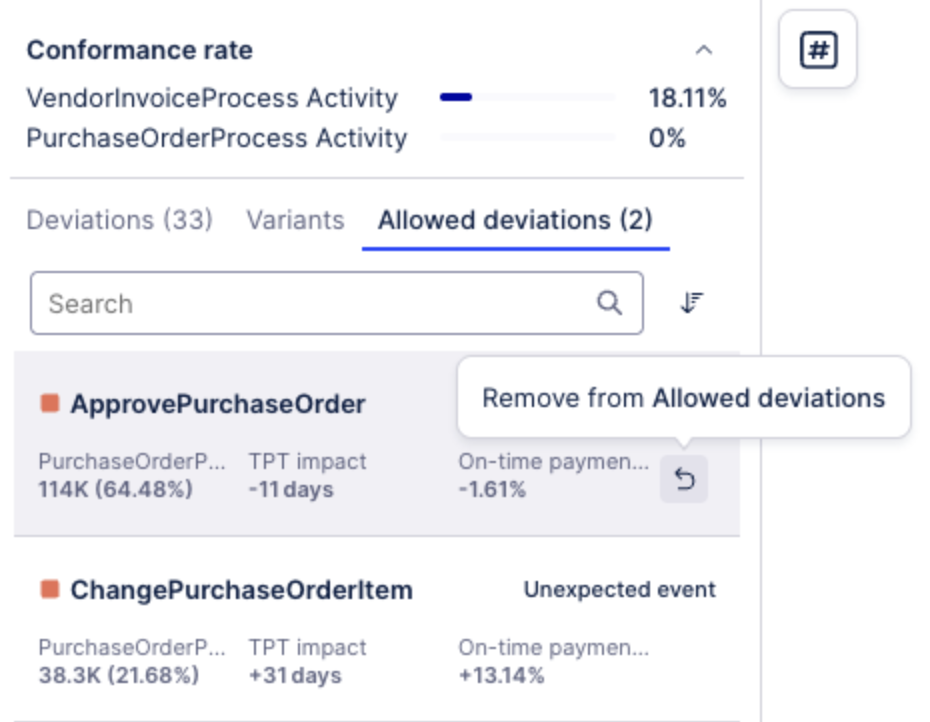
From here, you can allowlist deviations by hovering over them in the list and selecting Allow deviation. You will then find your allowlisted deviations displayed in the Allowed deviations tab. You can also remove deviations from this list as desired.
When you’re done with setting up your Adherence Explorer, save your View and use it like any other component.
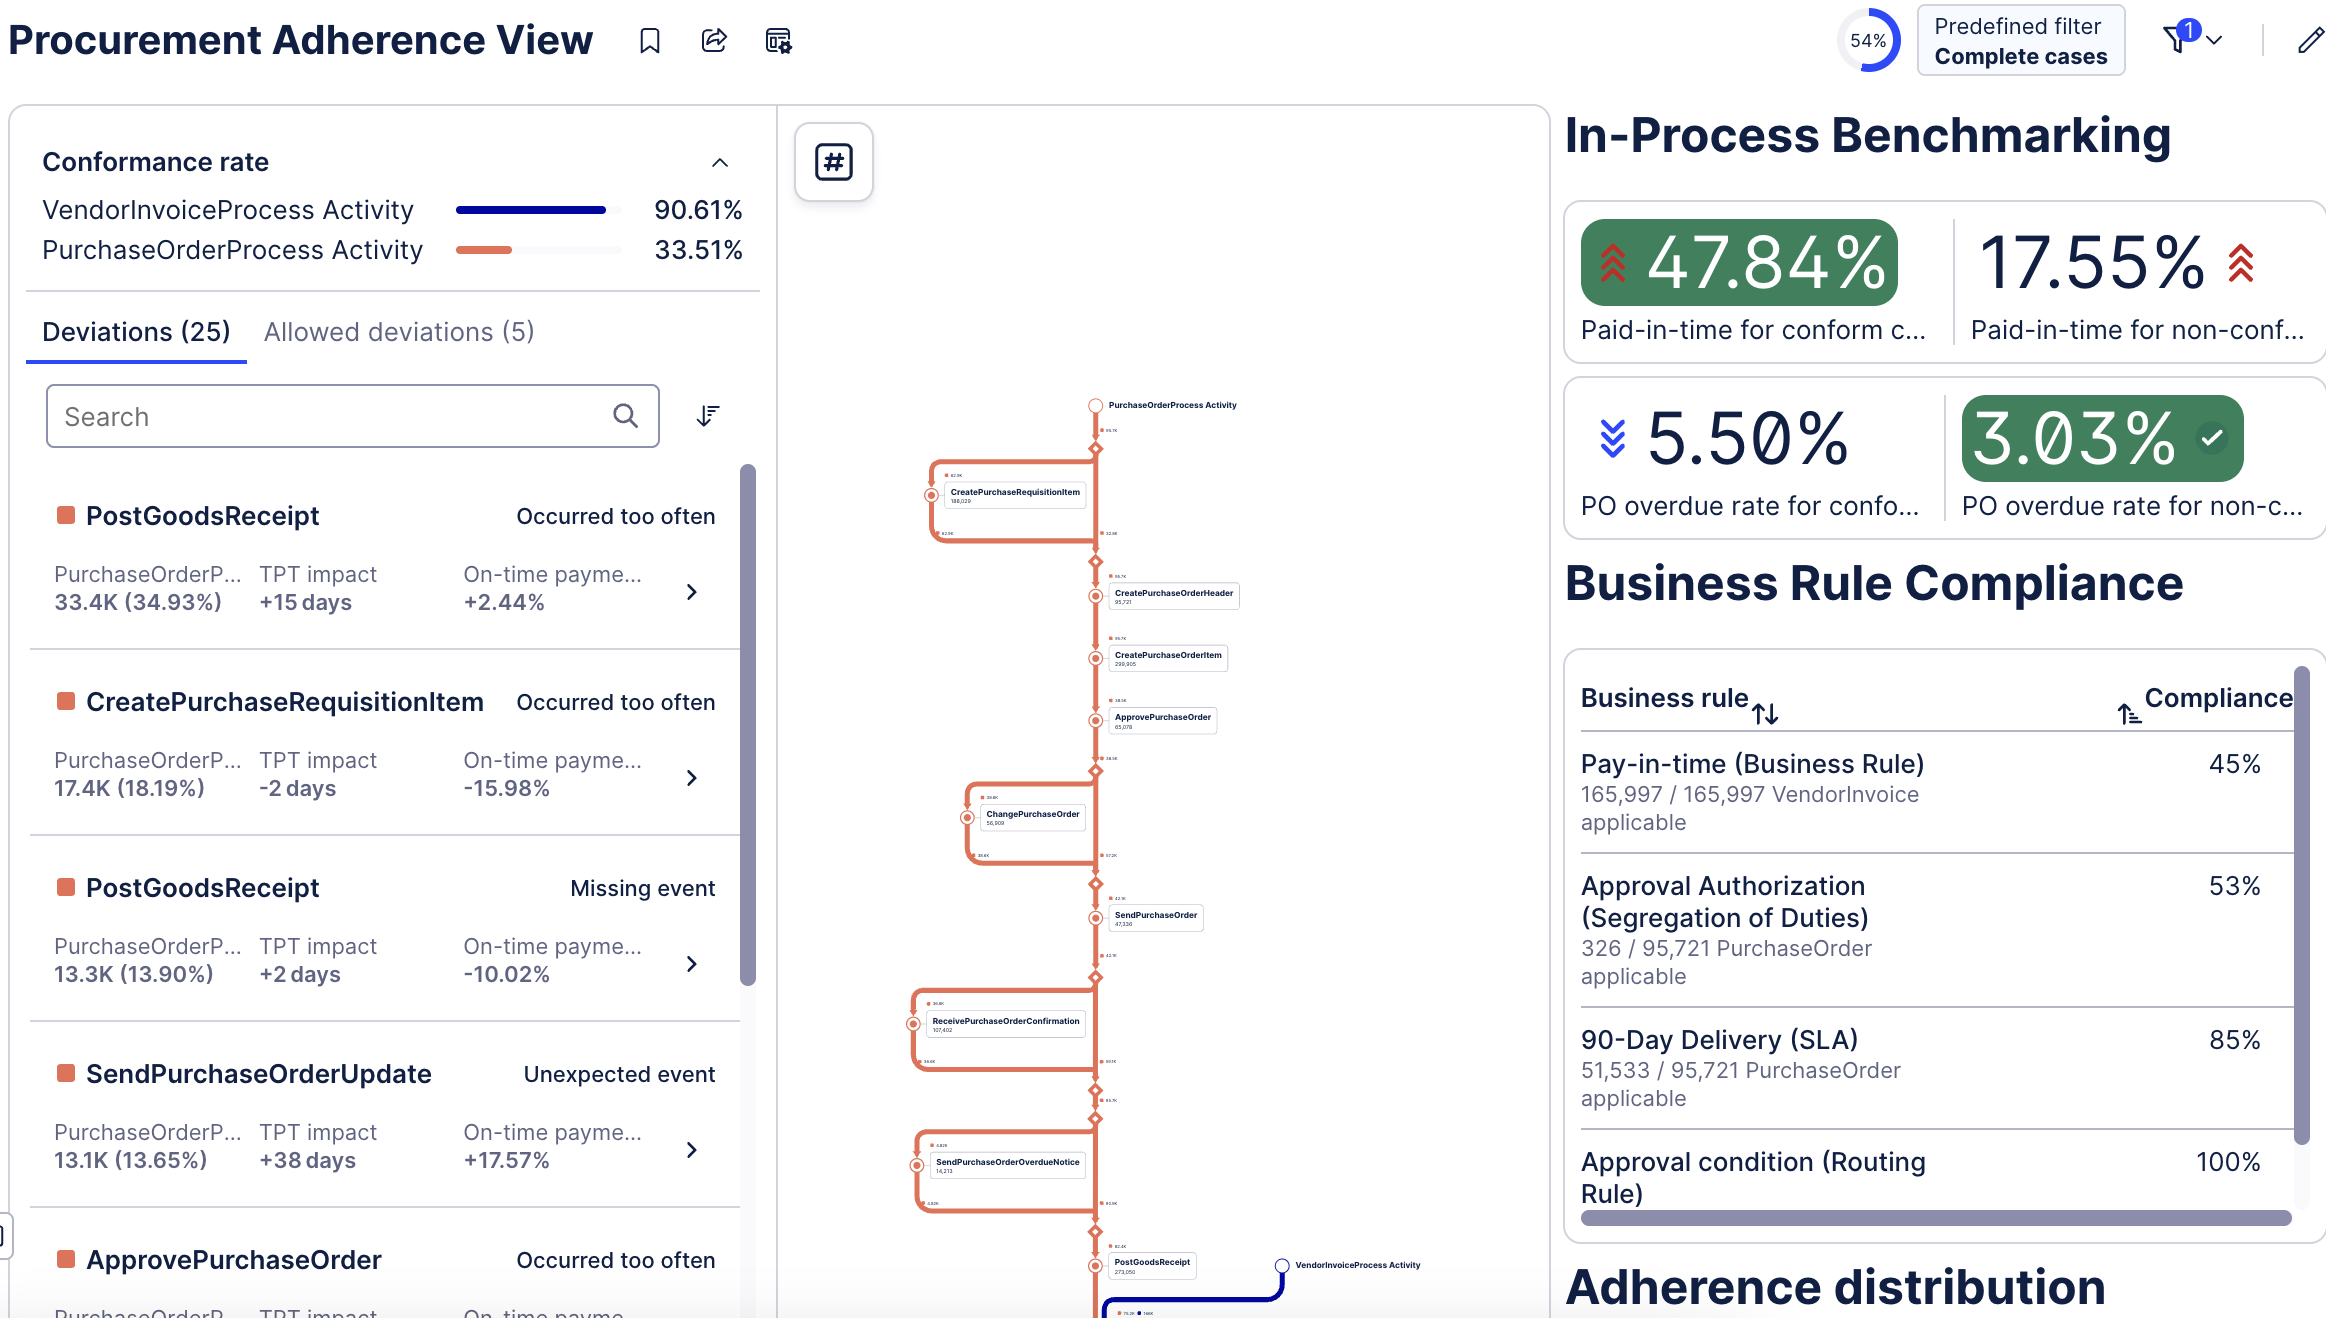
Once set up, you can use Adherence Explorer the same as any other View. Let's build a dashboard showing us the conformance rate using Adherence Explorer.
To create a dashboard with Adherence Explorer, follow these steps:
Configure a KPI card with conformance as an attribute, making sure to use the same knowledge model as the one you set up in PAM.
Set the attribute to calculate the average over all cases and format it as a percentage.
Next, analyze the conformance rate over time using a bar char. Use whatever dimension is applicable to your use case as a bar definition and conformance (avg) as the metric.
Add a case explorer component so you can see an overview of deviating cases.
Now you can filter the entire View based on a deviation and analyze each case with that particular deviation.
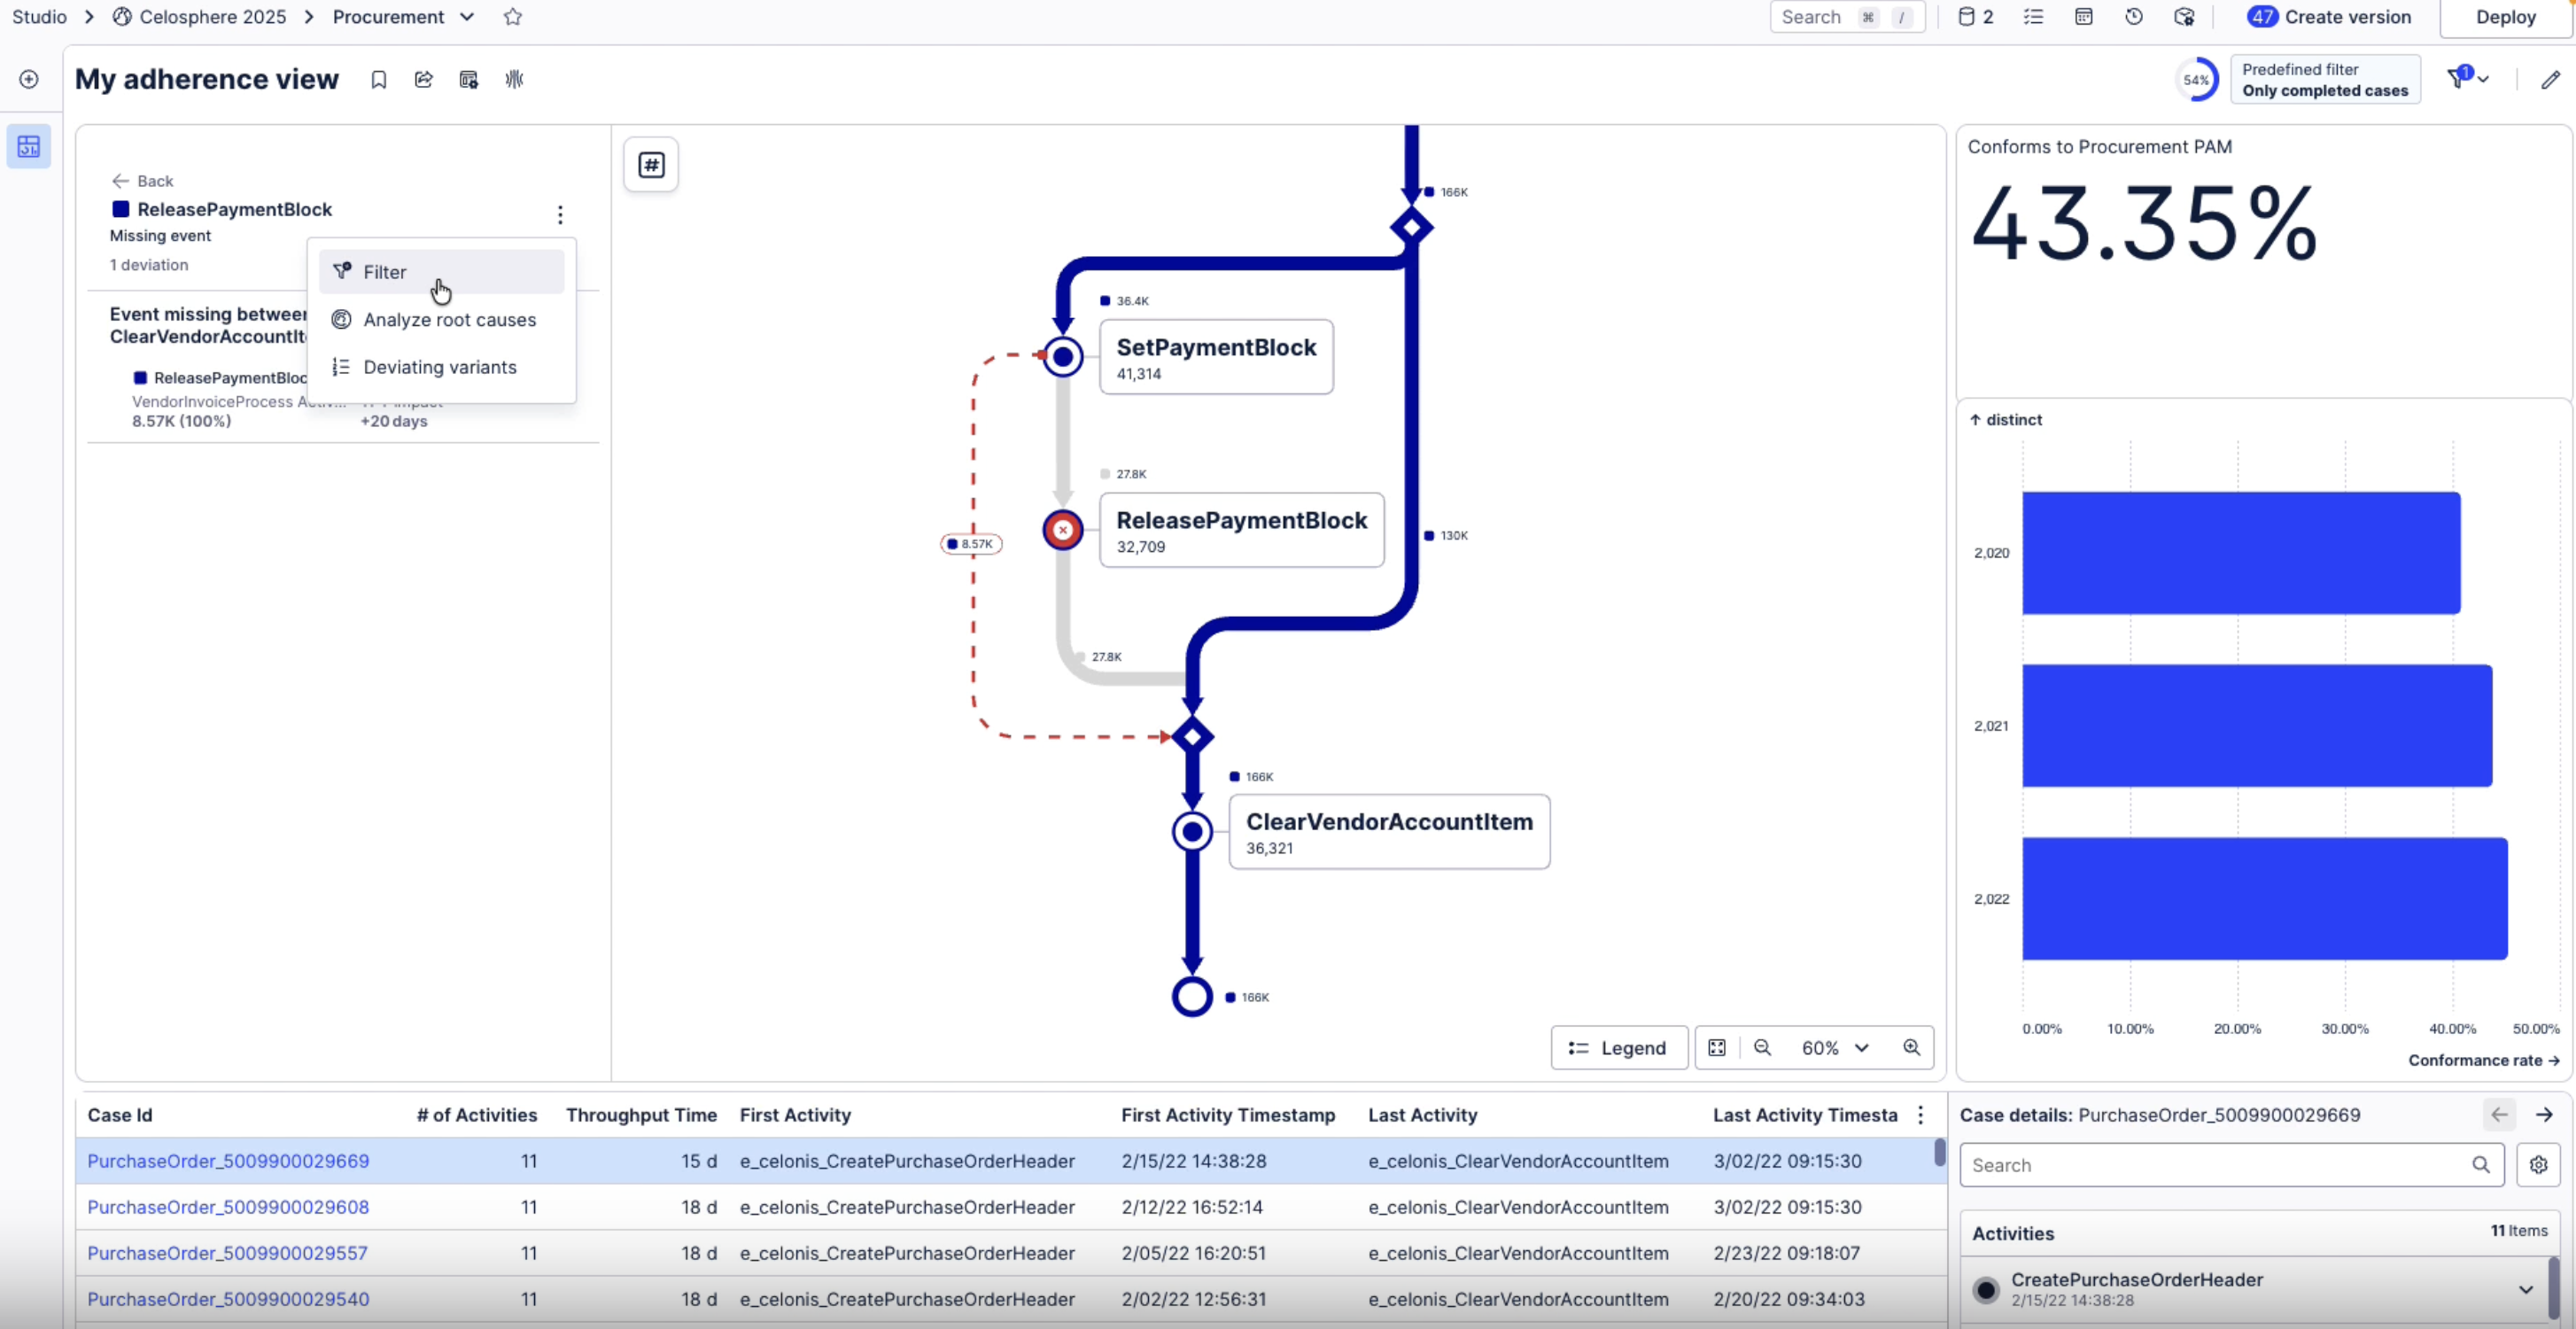
Adherence Explorer can show you deviations in your model, as well as help you identify the drivers.
To explore deviations from the target process in Adherence Explorer, follow these steps:
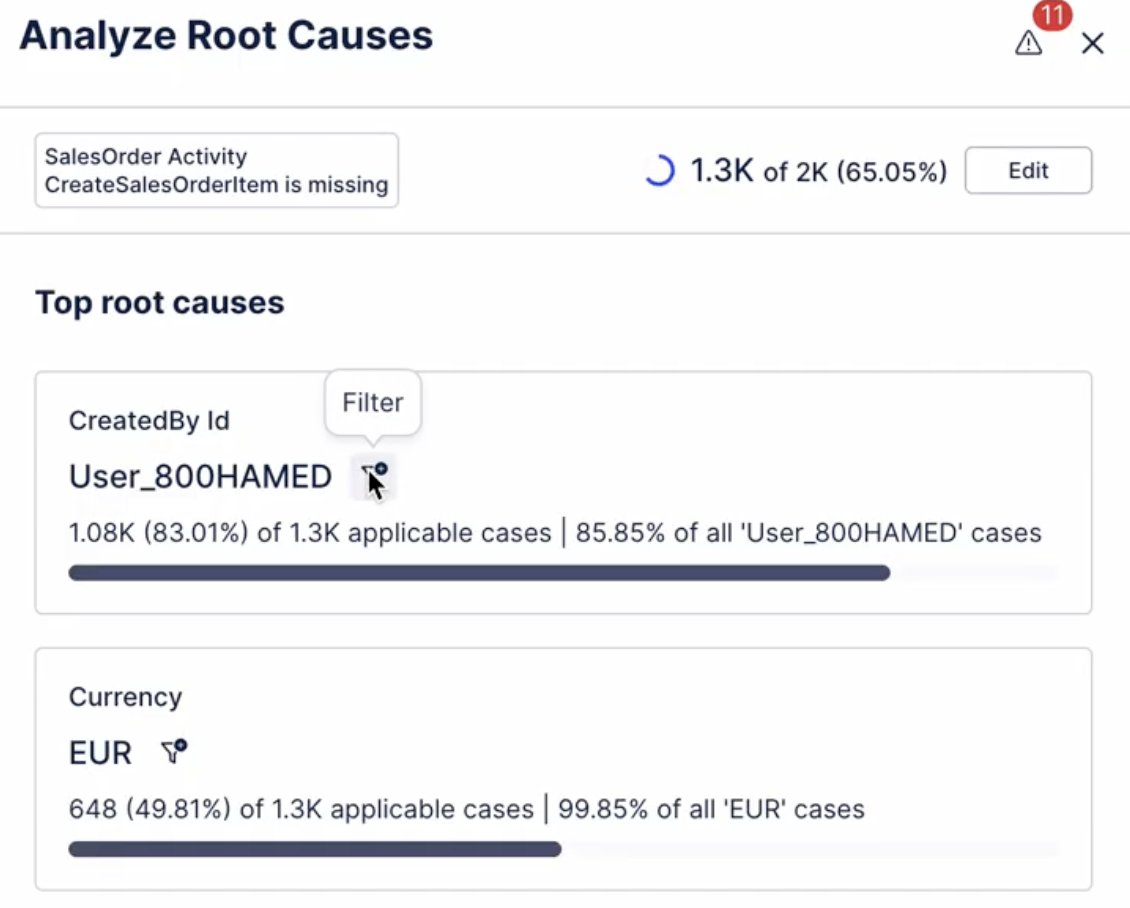
In Adherence Explorer, open the deviations list and hover over the deviation you want to analyze. Select the Analyze root causes button.
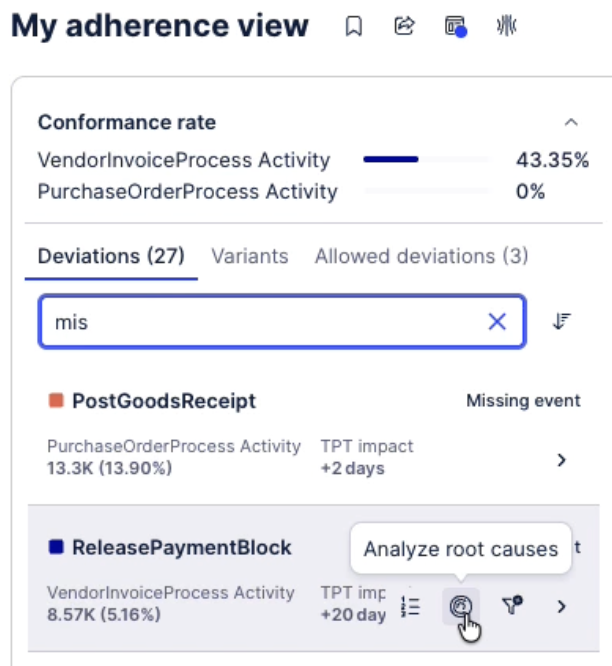
In the Analyze root causes menu, select all the attributes you want to analyze from the drop-down list and click the Run analysis button. When the analysis is complete, PAM will show you a list of all the drivers of that particular deviation.
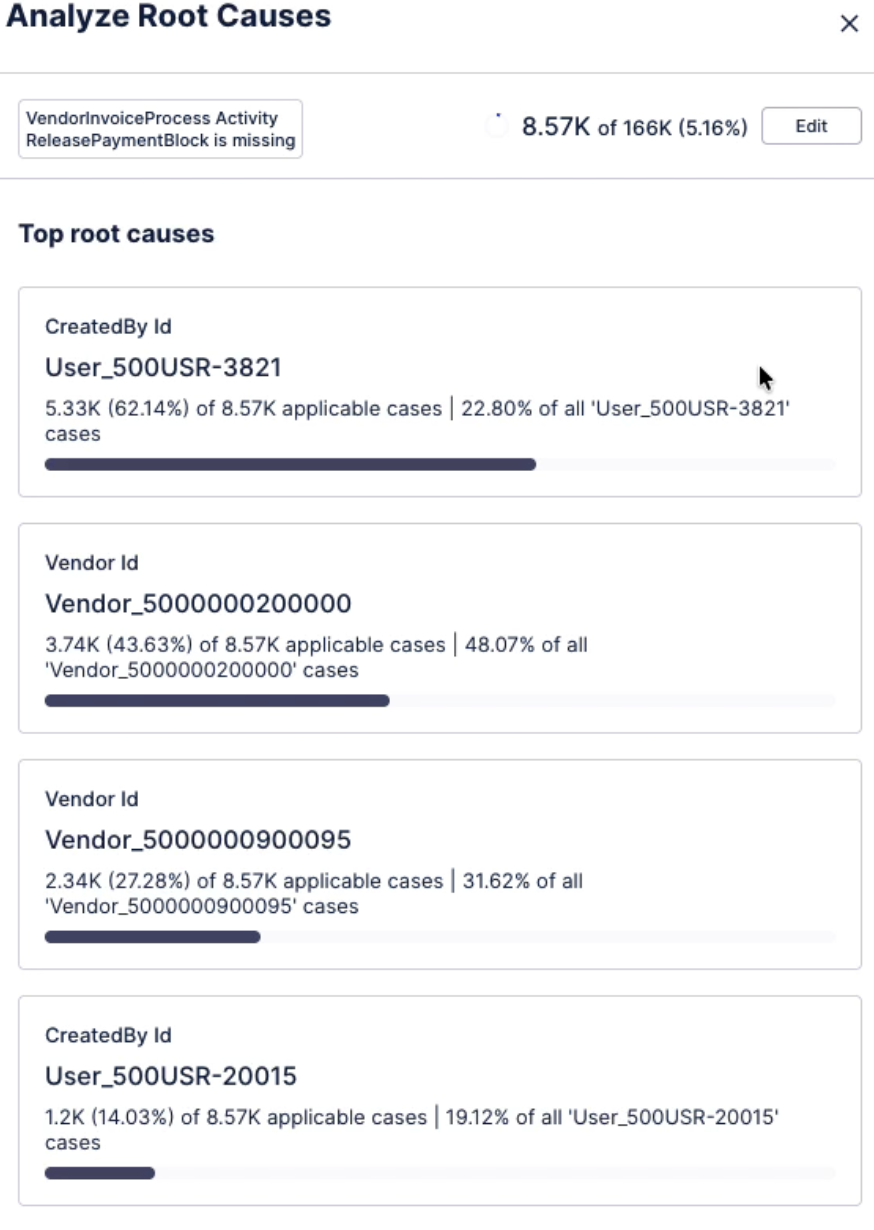
You can also choose to filter your model by a specific root cause.