Configuring Charts in legacy views
Legacy view component
You're currently viewing a topic about a legacy view component in Studio. This component can still be used in legacy Studio views, however we recommend using the visual view editor in the new Studio experience. The updated interface includes drag and drop capabilities, allowing you to easily add components and configure your views.
For more information, see: Views.
You can visually display your data using area, bar, line, lollipop, scatter plot, and stacked charts in your studio view. Each chart type can then be customized further, giving you control over their look and feel.
The main component of every chart is visuals, which are used to define how the chart is visually displayed. Visuals are further defined using mark and encoding:
Mark: This defines the chart type (such as area, bar, and line charts) used to display data items (such as invoices and purchase orders). For more information about mark configuration properties, see Mark configuration properties.
Encoding: These define how data attributes (such as customer name, due date, value) of these data items are mapped to specific visual properties (such as color, x-position, y-position). For more information about encoding, see: Specifying encodings for charts and Encoding configuration properties.
Simple bar chart example
If you want to create simple charts that only contain one type of mark (such as a bar chart), you specify one visual using the lines mark: bar and with encodings for X and Y axis.
The example YAML for this is:
id: cashflow2-new
type: chart
settings:
  name: Cash
  showLegend: true
  visuals:
    - mark: bar
      encodings:
        y: PAYROLL_TS
                x:
          field: CASHFLOW_EVENTTIME_TS
          format: Q%q
          type: ordinal
Multiple visuals chart example (using a bar and line chart)
For a combination of multiple graphical objects in one chart (such as bars and lines in one chart), you can layer multiple visuals with each of them defining a different mark. This way, you can create more complex charts such as this bar and line chart example YAML.
id: kpi_chart
type: chart
settings:
  encodings:
    x:
      field: ENTRY_QUARTER
      type: ordinal
      format: Q%q
  visuals:
    - mark: bar
      legend: Invoice Volume '20
      encodings:
        y:
          field: KPI_TOTAL_INVOICE_VALUE
          format: $.2s
          axis:
            title: Invoice Volume
            position: left
    - mark:
        type: line
        point: true
      legend: ADD '20
      encodings:
        y:
          field: KPI_DAYS_DELINQUENT_2020
          units: " d"
          axis:
            title: " "
            position: right
Available chart types
The following chart types are available:
Chart type | Example | Example YAML | |
|---|---|---|---|
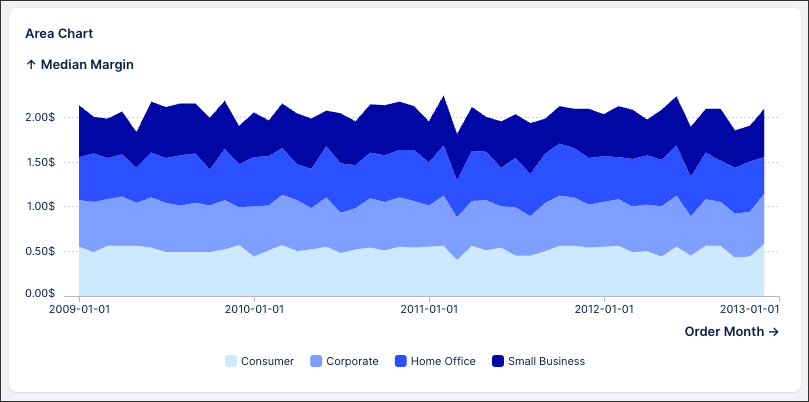
Area |
| id: ar
type: chart
settings:
name: Area Chart
limit: 1000
visuals:
- id: 9c09ceb2-dd9d-45f6-ba55-3dbb925d2b6b
mark:
type: area
order: 100
encodings:
color:
field: SUPERSTORE.CUSTOMER_SEGMENT
scheme: SEQUENTIAL
stackBy: SUPERSTORE.CUSTOMER_SEGMENT
encodings:
x:
axis:
position: bottom
field: SUPERSTORE.order_month
y:
axis:
position: left
field: SUPERSTORE.median_margin | |
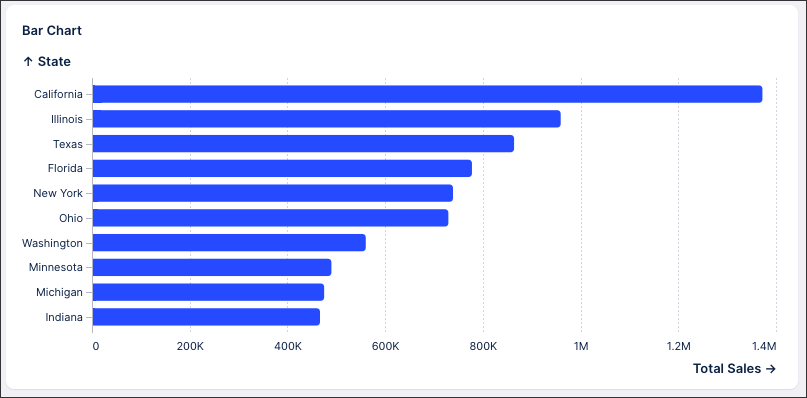
Bar |
| id: BAR
type: chart
settings:
name: Bar Chart
limit: 10
sortBy:
- id: ca06a68f-834f-465b-a5ac-a0cc8779c8ba
field: SUPERSTORE.total_sales
order: 100
direction: DESC
visuals:
- id: 32acf47e-e928-4fb1-85de-6a593eb9979c
mark:
type: bar
bandwidth: 0
order: 100
encodings:
x:
axis:
position: bottom
field: SUPERSTORE.total_sales
format: .2~s
y:
axis:
position: left | |
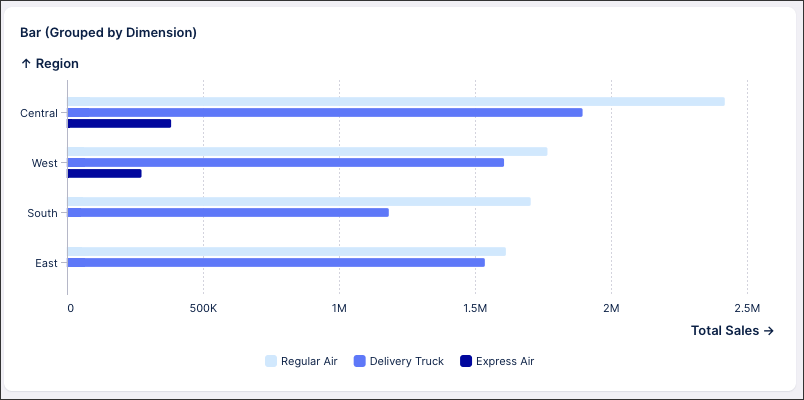
Bar (Grouped by dimensions) Note Limiting and sorting is not supported for this chart type. |
| id: bar-grouped
type: chart
settings:
name: "Bar (Grouped by Dimension) "
limit: 10
sortBy:
- id: ca06a68f-834f-465b-a5ac-a0cc8779c8ba
field: SUPERSTORE.total_sales
order: 100
direction: DESC
visuals:
- id: 32acf47e-e928-4fb1-85de-6a593eb9979c
mark:
type: bar
bandwidth: 0
order: 100
encodings:
color:
type: nominal
field: SUPERSTORE.SHIP_MODE
scheme: SEQUENTIAL
groupBy: SUPERSTORE.SHIP_MODE
encodings:
x:
axis:
position: bottom
field: SUPERSTORE.total_sales
format: .2~s
y:
axis:
position: left
field: SUPERSTORE.REGION | |
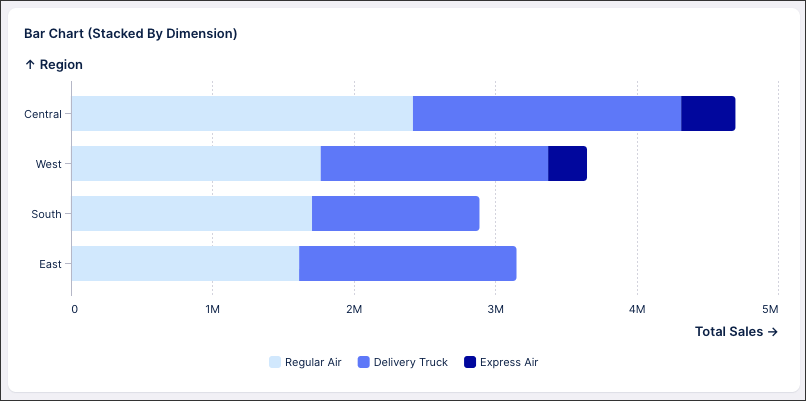
Bar (stacked by dimensions) Note Limiting and sorting is not supported for this chart type. |
| id: bar_stacked
type: chart
settings:
name: Bar Chart (Stacked By Dimension)
limit: 10
sortBy:
- id: ca06a68f-834f-465b-a5ac-a0cc8779c8ba
field: SUPERSTORE.total_sales
direction: DESC
order: 100
visuals:
- id: 32acf47e-e928-4fb1-85de-6a593eb9979c
mark:
type: bar
bandwidth: 0
order: 100
encodings:
color:
type: nominal
field: SUPERSTORE.SHIP_MODE
scheme: SEQUENTIAL
stackBy: SUPERSTORE.SHIP_MODE
encodings:
x:
axis:
position: bottom
field: SUPERSTORE.total_sales
format: .2~s
y:
axis:
position: left
field: SUPERSTORE.REGIONid: CHART_COSTS
type: chart
settings:
name: Costs
showLegend: true
encodings:
x:
field: EXPENSES_EVENTTIME_TS
type: ordinal
format: Q%q
color:
field: EXPENSES_TYPE
scheme: DIVERGING_BLUE_TO_PINK
visuals:
- mark:
type: bar
encodings:
y:
field: EXPENSES_USD_TS
stackBy: EXPENSES_TYPE
| |
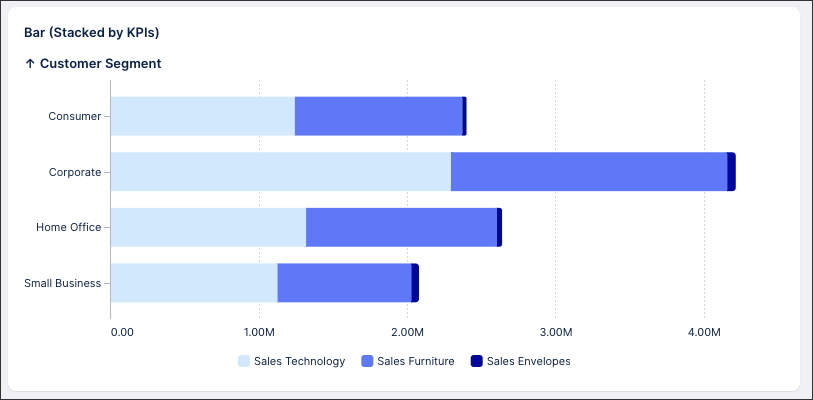
Bar (Stacked by KPIs) |
| id: groupedStackedChart type: chart settings: name: Grouped - Stacked bar chart per Quarter (stacked KPIs) encodings: x: field: TIMEQUARTER type: ordinal format: Q%q visuals: - mark: bar encodings: y: stack: - - WON - COMMIT - - COMMIT_RISK - BEST_CASE - PIPELINE | |
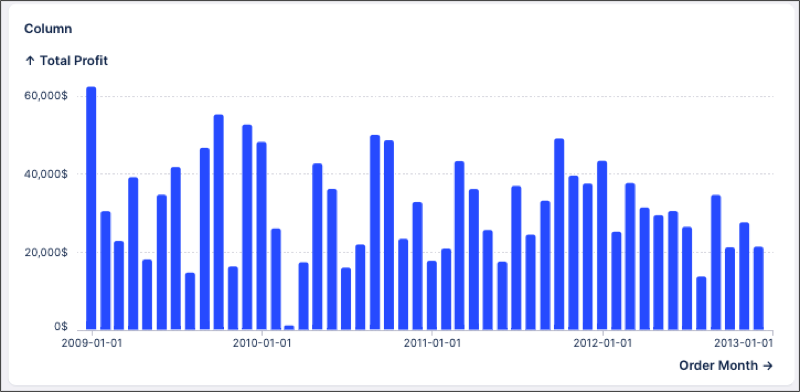
Column |
| id: column
type: chart
settings:
name: Column
limit: 1000
sortBy:
- id: 6eefbfc5-a680-4dec-bd4e-8f4b2695cac8
field: SUPERSTORE.total_profit
direction: DESC
order: 100
visuals:
- id: 65689c7c-b6b4-4ad7-9797-ac21f189d9f5
mark:
type: bar
color: BLUE
bandwidth: 0
order: 100
encodings:
x:
axis:
position: bottom
field: SUPERSTORE.order_month
y:
axis:
position: left
field: SUPERSTORE.total_profit | |
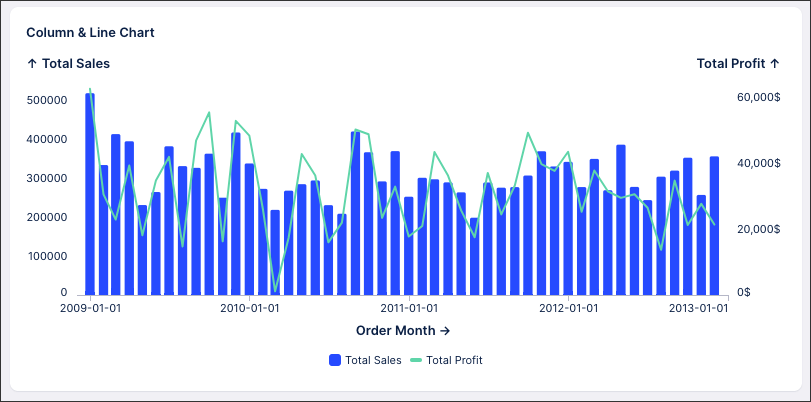
Column and line |
| id: column_line
type: chart
settings:
name: Column & Line Chart
limit: 1000
visuals:
- id: ce9c1caa-cd3b-4e5d-a837-1b7694540a08
mark:
type: bar
bandwidth: 0
order: 100
- id: f66aad27-dbeb-4775-b851-13777151b665
mark:
type: line
order: 200
encodings:
y:
axis:
position: right
field: SUPERSTORE.total_profit
encodings:
x:
field: SUPERSTORE.order_month
y:
field: SUPERSTORE.total_sales | |
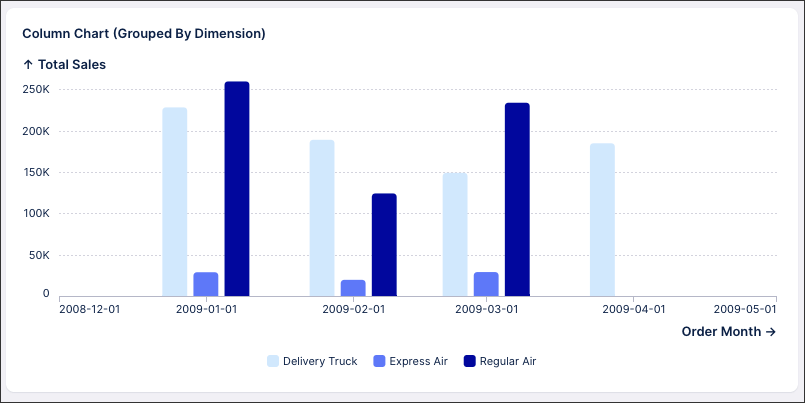
Column (grouped by dimension) |
| id: column_grouped
type: chart
settings:
name: Column Chart (Grouped By Dimension)
limit: 10
visuals:
- id: 32acf47e-e928-4fb1-85de-6a593eb9979c
mark:
type: bar
bandwidth: 0
order: 100
encodings:
color:
field: SUPERSTORE.SHIP_MODE
scheme: SEQUENTIAL
groupBy: SUPERSTORE.SHIP_MODE
encodings:
x:
axis:
position: bottom
field: order_month
y:
axis:
position: left
field: SUPERSTORE.total_sales
format: .2~s
| |
Column (stacked by KPIs) | 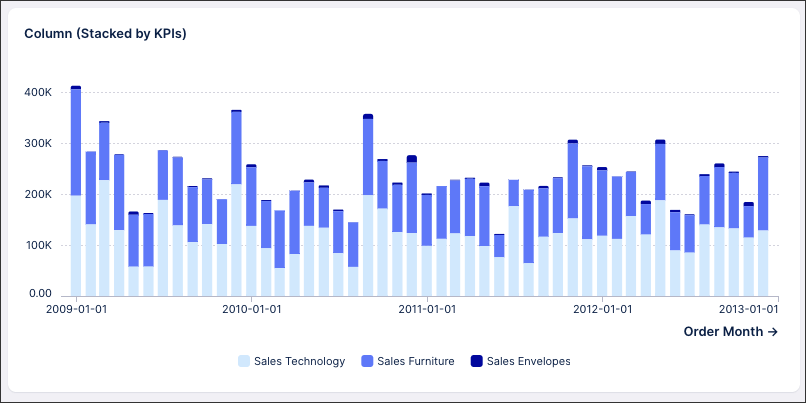 | id: column_stacked
type: chart
settings:
name: Column (Stacked by KPIs)
limit: 1000
colors: SEQUENTIAL
visuals:
- id: 691b24b0-e1e4-4035-b284-3cfa247725fd
mark:
type: bar
labels:
color: RED
visible: false
bandwidth: 0
order: 100
encodings:
x:
axis:
position: bottom
field: order_month
y:
axis:
position: left
stack:
- group:
- kpi: sales_technology
- kpi: sales_furniture
- kpi: sales_envelopes
| |
GANTT | 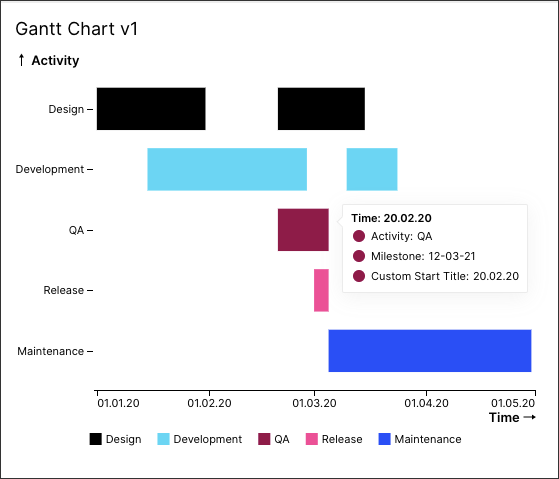 | id: ganttChart type: chart settings: name: Gantt Chart v1 interactions: selection: true tooltip: true sortBy: - field: GANTT_ACTIVITIES.START visuals: - mark: type: rect orientation: none encodings: x: field: GANTT_ACTIVITIES.START format: "%d.%m.%y" title: Time x2: GANTT_ACTIVITIES.END color: GANTT_ACTIVITIES.ACTIVITY y: GANTT_ACTIVITIES.ACTIVITY detail: - field: GANTT_ACTIVITIES.milestone - field: GANTT_ACTIVITIES.START title: Custom Start Title format: "%d.%m.%y" | |
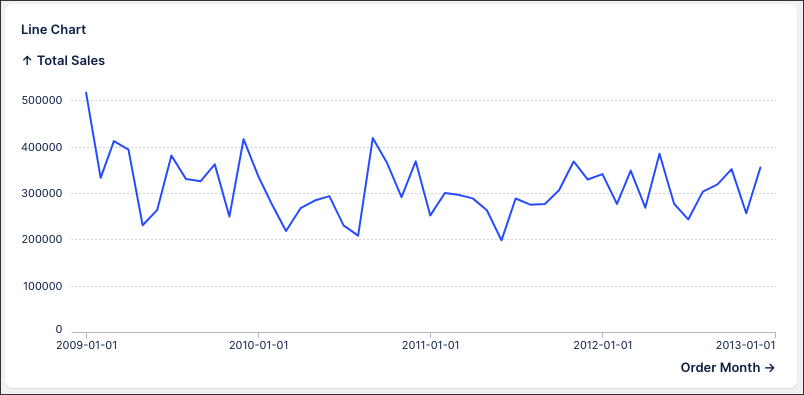
Line |
| id: line
type: chart
settings:
name: Line Chart
limit: 1000
visuals:
- id: a372ab01-1a3c-4c92-b425-e32bf345d957
mark:
type: line
order: 100
encodings:
y:
field: SUPERSTORE.total_sales
encodings:
x:
field: SUPERSTORE.order_month
| |
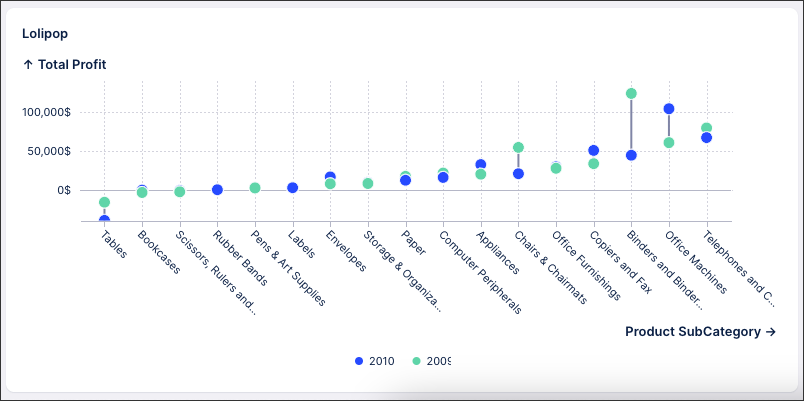
Lollipop |
| id: lollipop
type: chart
settings:
name: Lolipop
limit: 1000
sortBy:
- id: be052168-9a78-4b39-9c00-1006c1f713b7
field: SUPERSTORE.total_profit
direction: ASC
order: 100
visuals:
- id: 4b25e8ed-eb75-482c-9ade-aa0740e5d313
mark:
type: line
color: GRAY_60
order: 100
legend: false
encodings:
detail:
- field: SUPERSTORE.order_year
groupBy: SUPERSTORE.PRODUCT_SUBCATEGORY
- id: b0da1274-643f-4680-9707-88708b35a8ca
mark:
type: point
point:
width: 6
order: 200
encodings:
color:
type: ordinal
field: SUPERSTORE.order_year
scheme: CATEGORICAL
encodings:
x:
axis:
grid: true
position: bottom
field: SUPERSTORE.PRODUCT_SUBCATEGORY
y:
axis:
position: left
field: SUPERSTORE.total_profit
interactions:
tooltip: true
filters:
- id: filter_2009_2010
| |
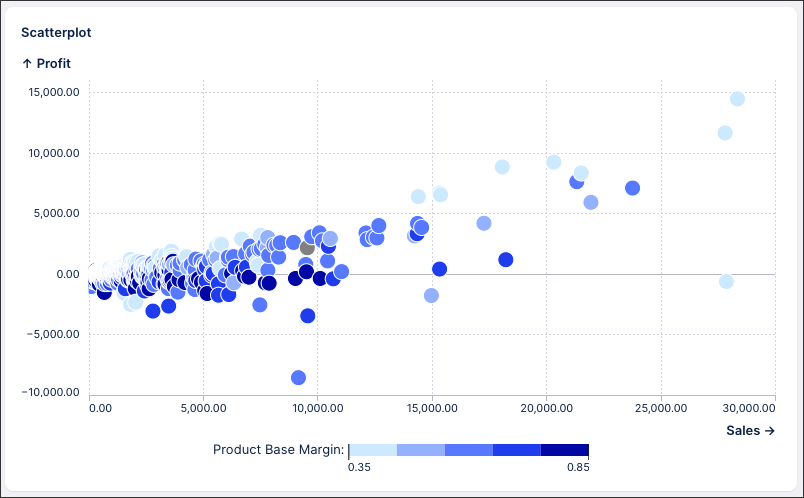
Scatterplot |
| id: scatterplot
type: chart
settings:
name: Scatterplot
limit: 1000
visuals:
- id: 3a40e351-7c13-4fb7-b8d2-f6d5988e4405
mark:
type: point
point:
width: 8
labels: false
order: 100
encodings:
color:
field: SUPERSTORE.PRODUCT_BASE_MARGIN
scheme: SEQUENTIAL_BLUE
encodings:
x:
field: SUPERSTORE.SALES
y:
field: SUPERSTORE.PROFIT |
Available chart customization options
You can configure your charts in a number of ways:
Customization option | Example | Example YAML | Additional information |
|---|---|---|---|
Add description / chart legend |  | id: myChart settings: showLegend: true - mark: encodings: y: axis: title: "My axis title" position: right | |
Add visuals (2+) | id: kpi_chart type: chart settings: encodings: x: field: ENTRY_QUARTER type: ordinal format: Q%q visuals: - mark: type: bar point: true legend: Invoice Volume '20 encodings: y: field: KPI_TOTAL_INVOICE_VALUE format: $.2s axis: title: Invoice Volume position: left - mark: type: line point: true legend: ADD '20 encodings: y: field: KPI_DAYS_DELINQUENT_2020 units: " d" axis: title: " " position: right | ||
Add visuals (3+) | id: kpi_chart type: chart settings: encodings: x: field: ENTRY_QUARTER type: ordinal format: Q%q visuals: - mark: type: bar point: true legend: Invoice Volume '20 encodings: y: field: KPI_TOTAL_INVOICE_VALUE format: $.2s axis: title: Invoice Volume position: left - mark: type: line point: true legend: ADD '20 encodings: y: field: KPI_DAYS_DELINQUENT_2020 units: " d" axis: title: " " position: right - mark: type: line point: shape: rect width: 40 legend: ADD '19 encodings: y: field: KPI_DAYS_DELINQUENT_2019 units: " d" axis: title: Average Days Delinquent position: right | ||
Add visuals (Single) | id: kpi_chart type: chart settings: encodings: x: field: ENTRY_QUARTER type: ordinal format: Q%q visuals: - mark: type: bar point: true legend: Invoice Volume '20 encodings: y: field: KPI_TOTAL_INVOICE_VALUE format: $.2s axis: title: Invoice Volume position: left | You can select one or more visuals to be shown on your chart: | |
Change colors | id: myChart settings: colors: SEQUENTIAL_BLUE Available color schemes: # Categorical CATEGORICAL CATEGORICAL_ALT_1 CATEGORICAL_ALT_2 CATEGORICAL_ALT_3 # Diverging DIVERGING_CYAN_TO_ORANGE DIVERGING_BLUE_TO_PINK DIVERGING_PURPLE_TO_TEAL DIVERGING_GREEN_TO_RED DIVERGING_GREEN_TO_YELLOW_TO_RED DIVERGING_ORANGE_TO_CYAN DIVERGING_PINK_TO_BLUE DIVERGING_TEAL_TO_PURPLE DIVERGING_RED_TO_GREEN DIVERGING_RED_TO_YELLOW_TO_GREEN # Sequential SEQUENTIAL_GRAY SEQUENTIAL_CYAN SEQUENTIAL_TEAL SEQUENTIAL_BLUE SEQUENTIAL_PURPLE SEQUENTIAL_PINK SEQUENTIAL_RED SEQUENTIAL_ORANGE SEQUENTIAL_YELLOW SEQUENTIAL_GREEN SEQUENTIAL_GRAY_REVERSE SEQUENTIAL_CYAN_REVERSE SEQUENTIAL_TEAL_REVERSE SEQUENTIAL_BLUE_REVERSE SEQUENTIAL_PURPLE_REVERSE SEQUENTIAL_PINK_REVERSE SEQUENTIAL_RED_REVERSE SEQUENTIAL_ORANGE_REVERSE SEQUENTIAL_YELLOW_REVERSE SEQUENTIAL_GREEN_REVERSE | ||
Disable tool tips | 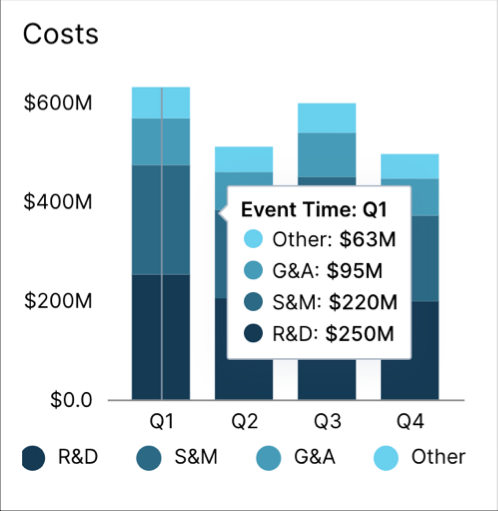 | id: myChart settings: interactions: tooltip: false | |
Highlight selections (disabled by default) | 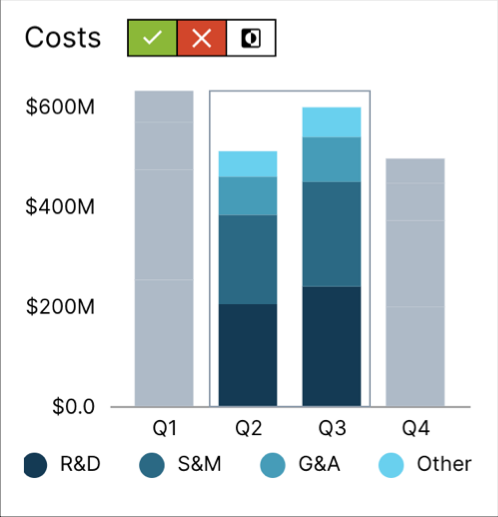 | id: myChart settings: interactions: selection: true | Please note that not all fields are selectable (i.e., filterable). In particular, fields containing standard aggregations, FILTER_TO_NULL statements, or special cases such as FILTERED_ABC, KMEANS and LINEAR_REGRESSION with a model trained using TRAIN_FILTERED_KM / TRAIN_FILTERED_LM, and window aggregations cannot be filtered. |
Multiple visuals per chart | 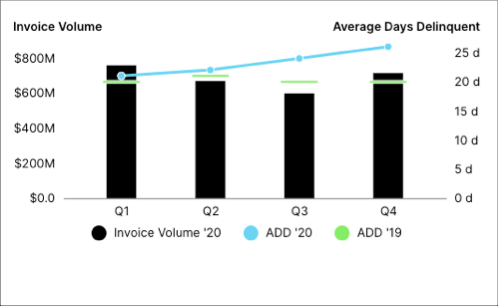 | id: kpi_chart type: chart settings: encodings: x: field: ENTRY_QUARTER type: ordinal format: Q%q visuals: - mark: type: bar point: true legend: Invoice Volume '20 encodings: y: field: KPI_TOTAL_INVOICE_VALUE format: $.2s axis: title: Invoice Volume position: left - mark: type: line point: true legend: ADD '20 encodings: y: field: KPI_DAYS_DELINQUENT_2020 units: " d" axis: title: " " position: right - mark: type: line point: shape: rect width: 40 legend: ADD '19 encodings: y: field: KPI_DAYS_DELINQUENT_2019 units: " d" axis: title: Average Days Delinquent position: right | |
Position lines (set on the x axis) | 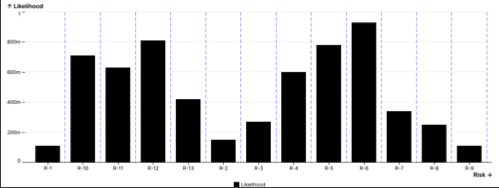 | settings: encodings: x: field: KPI y: field: KPI2 visuals: - mark: type: rule encodings: x: field: KPI3 | |
Position lines (set on the y axis) | settings: encodings: x: field: KPI y: field: KPI2 axis: position: right visuals: - mark: type: rule encodings: x: value: 30 | ||
Position lines with constant value | 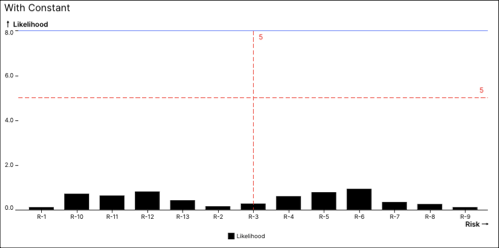 | settings: encodings: x: field: KPI y: field: KPI2 visuals: - mark: type: rule encodings: x: value: 30 | |
Position lines with datum | 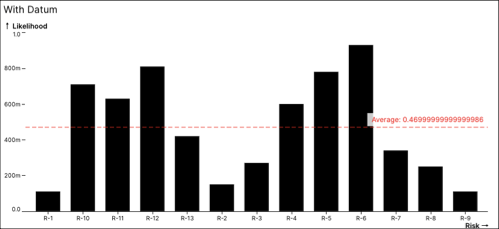 | settings: encodings: x: field: KPI y: field: KPI2 visuals: - mark: type: rule encodings: x: datum: KPI3 | |
Sort or order | 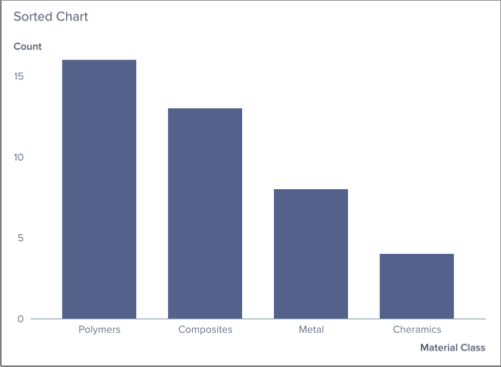 | id: sortedChart type: chart settings: sortBy: - field: MATERIAL_CLASS direction: ASC visuals: - mark: type: bar encodings: y: field: COUNT_TABLE__STACKINGSAMPLE - mark: type: line encodings: y: field: COUNT_TABLE__STACKINGSAMPLE_two encodings: x: field: MATERIAL_CLASS | Note Sorting is not supported in charts that are stacked or grouped by multiple dimensions" |
Target lines (Disable) | settings: encodings: x: field: KPI kpiTargets: false y: field: KPI2 | ||
Target lines (Enable) | 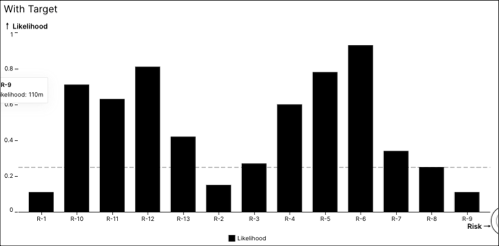 | settings: encodings: x: field: KPI y: field: KPI2 | If one of the chart's encodings is a KPI that has a target, a target line is shown by default on the point where the KPI target marks. Assuming one of the KPIs has a defined target (KPI targets can be set on KPI lists) the example YAML will show a target line. |
Specifying encodings for charts
Chart encodings can be specified in two ways:
Visuals: Every visual needs at least encodings for x and y positions to know what data attributes should define the spatial layout of the visual.
Direct property of settings: This can be helpful if you have multiple visuals in one chart which all use the same x-axis. In this case, you can save effort by defining the common x encoding at this root level. The encodings specified at this root level will be used by all visuals that do not specify a respective encoding of their own.
Encoding configuration properties
Encoding is an object that can contain sub-objects x, y, color, text. These sub-objects can then contain the following properties:
Property | Type | Description | |||||||||||||||||||||
|---|---|---|---|---|---|---|---|---|---|---|---|---|---|---|---|---|---|---|---|---|---|---|---|
field | <KnowledgeModel AttributeId> | Required. A string reference to an attribute in the connected knowledge model from which to pull the data. | |||||||||||||||||||||
type | "nominal" | "ordinal" | "quantitative" | "temporal" | The type of measurement for the encoded field. Default: The default value of type is based on the primitive data type of the encoded field:
As the type property describes the semantics of the data rather than the primitive data type, the defaults are only an educated guess. For example, although zip codes are numbers, their measurement type should be nominal as they represent categorical IDs rather than quantitative measures. In such cases, it is advisable to manually set the type property. | |||||||||||||||||||||
title | String | The title of the encoding is used in the tooltip, in the legend, and as the axis title. Default: The default value of title is the displayName of the encoded field/attribute from the Knowledge Model. | |||||||||||||||||||||
format | String | The format property takes a format specifier string as available in d3-format (for number formatting) and d3-time-format (for date formatting). | |||||||||||||||||||||
units | String | The units will be added postfix to every formatted data value. Default: The default value of units is the unit property of the encoded field/attribute from the Knowledge Model. | |||||||||||||||||||||
domain | Array | The domain property can be used to specify a custom domain for the encoding. Default: The default domain will automatically be calculated from the values in the encoded data field. Note This property can be overridden if used in visual level encoding by another visual so it's suggested to set this property in top(chart) level encoding. Examples:
| |||||||||||||||||||||
kpiParams | |||||||||||||||||||||||
Properties specific to X and Y encodings: | |||||||||||||||||||||||
axis | AxisSpec | An axis specification object:
| |||||||||||||||||||||
stackBy | <KnowledgeModel AttributeId> | A string reference to an attribute in the connected knowledge model that is used to split a bar or area into multiple stacked parts. Note Currently only supported in combination with mark: bar or mark: area. | |||||||||||||||||||||
groupBy | <KnowledgeModel AttributeId> | A string reference to an attribute in the connected knowledge model that is used to create grouped bars. Note Currently only supported in combination with mark: bar. | |||||||||||||||||||||
stack | Array of <KnowledgeModel AttributeId> | ||||||||||||||||||||||
zeroBased | true | false | Default: true. Note This property can be overridden if used in visual level encoding by another visual so it's suggested to set this property in top(chart) level encoding. | |||||||||||||||||||||
kpiTargets | true | false | Whether to show KPI target lines Default: true. | |||||||||||||||||||||
Properties specific to X and Y encodings within visuals | |||||||||||||||||||||||
datum | <KnowledgeModel KpiId> | A string reference to a KPI in the connected knowledge model that resolves to a constant value. Note As opposed to field, the datum KPI is not queried with the other fields but queried independently. This is useful for position lines. | |||||||||||||||||||||
value | String | Number | boolean | Date | Constant value to be used to map to a visual value. | |||||||||||||||||||||
Properties specific to Color Encoding: | |||||||||||||||||||||||
scheme | ColorScheme | A string reference to a color scheme. Color schemes usually start with one of the following prefixes: CATEGORICAL, SEQUENTIAL, or DIVERGING. For example: CATEGORICAL, SEQUENTIAL_BLUE, SEQUENTIAL_BLUE_REVERSE, DIVERGING_CYAN_TO_ORANGE. Default: The default value of scheme is based on the type property:
| |||||||||||||||||||||
thresholds | Number | ||||||||||||||||||||||
kpiTargets | true | false | Toggle | |||||||||||||||||||||
Mark configuration properties
Property | Type | Description | ||||||||||||
|---|---|---|---|---|---|---|---|---|---|---|---|---|---|---|
type | "line" | "bar" | "point" | "area" | "text" | "lollipop" | "rect" | "rule" | Required. The mark type defines the visual marks that will be shown for data items. Note You can exchange "bar" for "line" to see how the same data would look like with another representation. | ||||||||||||
labels | true | false | Whether to show data labels. | ||||||||||||
color | ColorEnum | Explicitly specify which color to use for the marks of this visual. By default the color will be assigned depending on the color scheme that you provided in the config. Possible color enum values are:
| ||||||||||||
orientation | "vertical" | "horizontal" | "none" | The orientation defines the tooltip behavior and whether bars should be vertically or horizontally oriented. Note If you specify orientation: horizontal, make sure to use the y encoding for the categorical values and the x encoding for the numerical values. | ||||||||||||
Properties specific to type: bar | ||||||||||||||
bandwidth | Number | Width of a bar in a bar chart in pixels. Default: The default value of bandwidth is calculated such that all bars just fit into the chart without overlap (and a bit of padding in between bars). Note Bars can never exceed the default bandwidth and thus will always fit into the chart without overlap. | ||||||||||||
padding | Number | Width in pixels of the whitespace between bars in a bar chart. encodings:
y:
field: SUPERSTORE.REGION
padding:
ordinal: 0.05
axis:
position: left | ||||||||||||
Properties specific to type: rule | ||||||||||||||
style | "solid" | "dashed" | The line style to be applied to the specified rules. | ||||||||||||
Properties specific to type: line | ||||||||||||||
point | true | false | PointSpec | Whether to show markers for every data point on the line. Specifying true will render markers on the line with default configuration. You can also specify a PointSpec object instead:
Default: false. | ||||||||||||