Configuring a treemap in legacy views
Legacy view component
You're currently viewing a topic about a legacy view component in Studio. This component can still be used in legacy Studio views, however we recommend using the visual view editor in the new Studio experience. The updated interface includes drag and drop capabilities, allowing you to easily add components and configure your views.
For more information, see: Views.
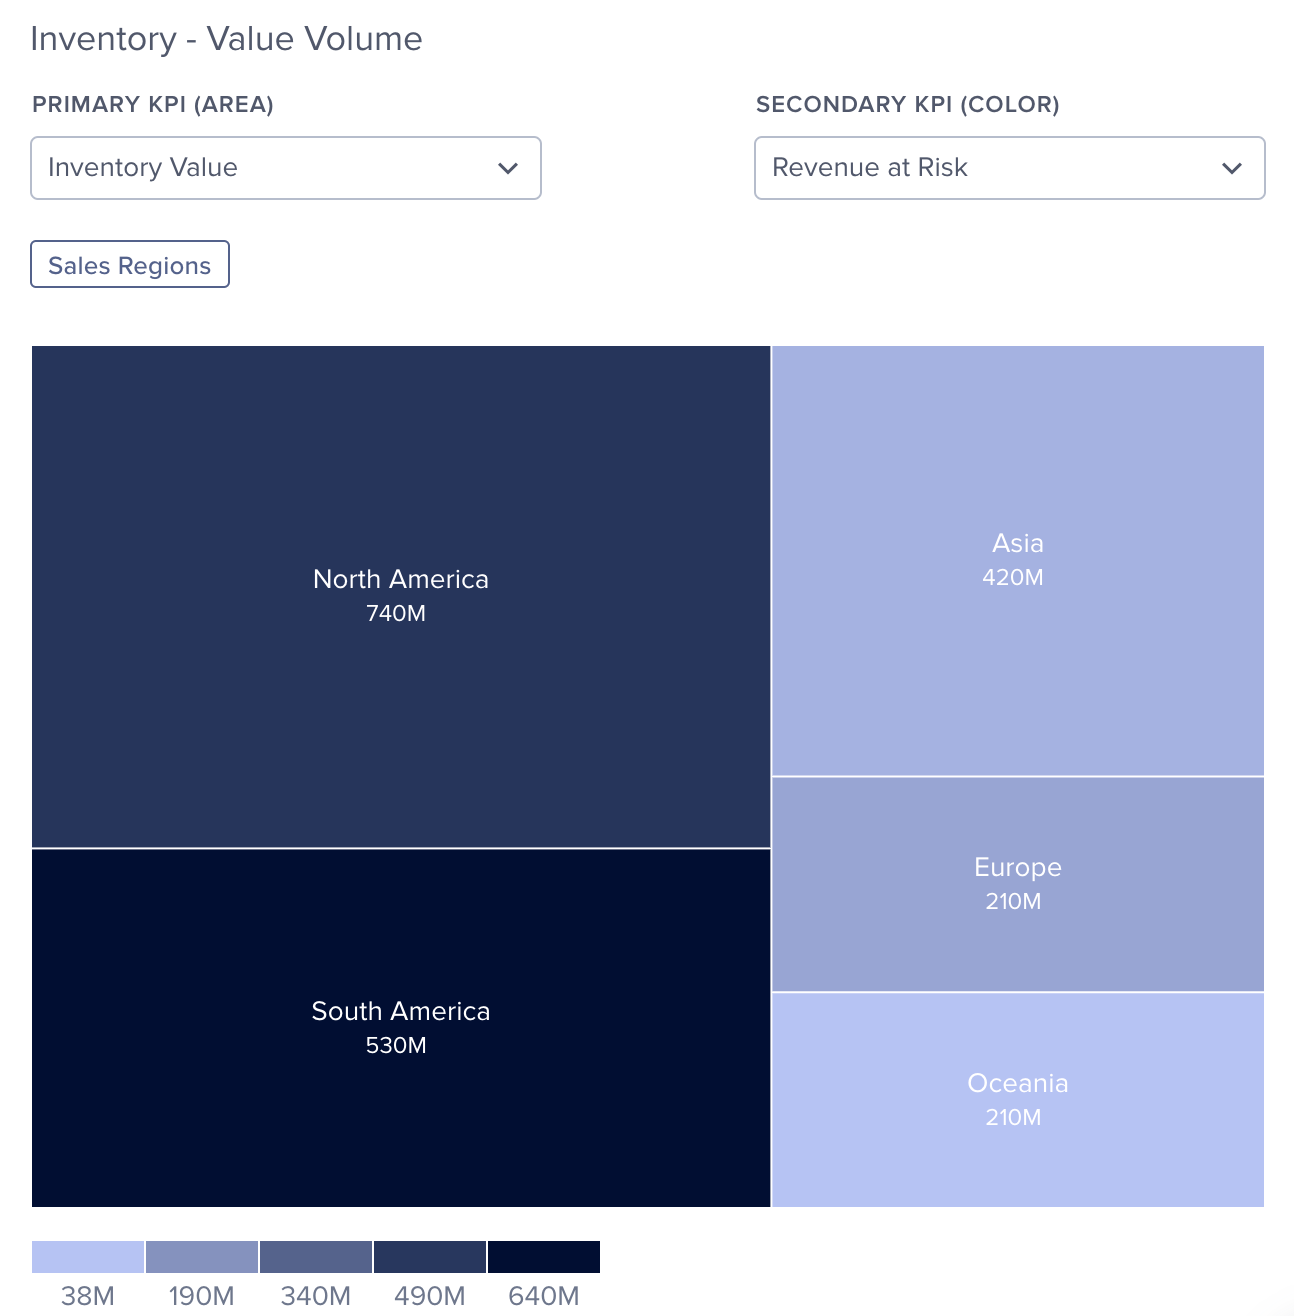
Display your data as a treemap, which shows hierarchical (tree-structured) data as a set of nested rectangles. The size and color of the rectangles can visually display up to two KPIs.
 |
Basic treemap configuration
To configure a basic task list component, the following attributes are available:
Attribute | Required | Type | Possible values | Description |
|---|---|---|---|---|
treemap | Yes | Chart | treemap | Add a treemap chart to your view. |
showConfig | Yes | Config | True False | Enable the selection of KPIs in the component. |
The example YAML for a basic treemap configuration:
id: value-volume-treemap
type: treemap
settings:
  name: Inventory - Value Volume
  showConfig: true
  colors: SEQUENTIAL_PURPLE
  dimensions:
    root: PLANT_CONTINENT_NAME
    child1: PLANT_COUNTRY_NAME
  kpis:
    - kpi: INVENTORY_VALUE_COUNTRY
      type: primary
      default: true
    - kpi: REVENUE_AT_RISK_TREEMAP
      type: primary
    - kpi: INVENTORY_VALUE_COUNTRY
      type: secondary
    - kpi: REVENUE_AT_RISK_TREEMAP
      type: secondary
      default: true